Decomposition as a Tool for Managing Complexity
Systems Architecture · Chapter 13
Figure 13.1 · A Product-Hierarchy Complexity Measure
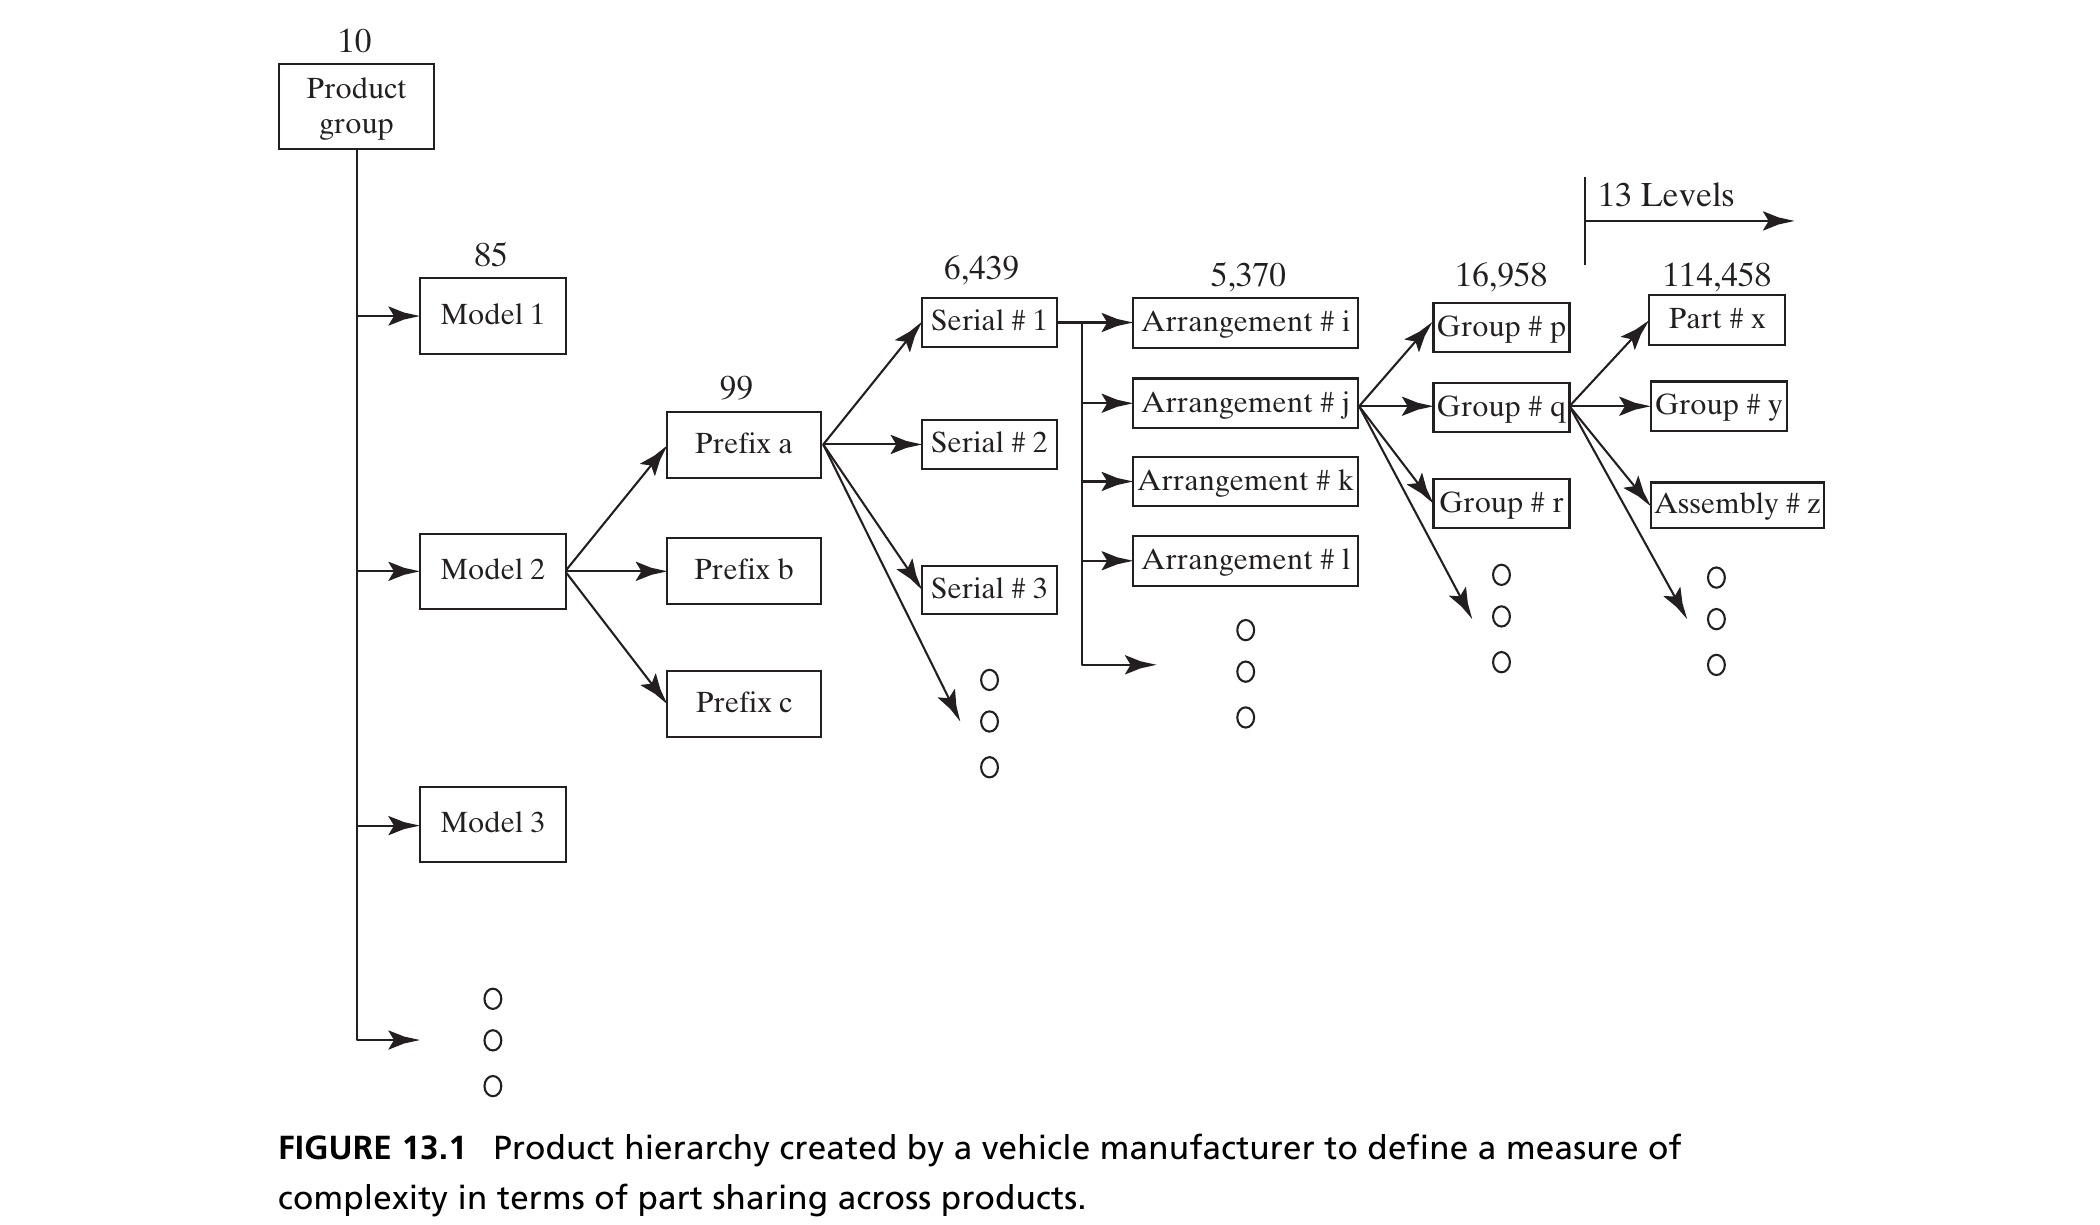
A vehicle manufacturer’s attempt to define complexity via part-sharing across a 13-level product hierarchy. The measure was not incorrect: but it was so cumbersome (the decomposition itself was never agreed upon) that it went unused. Source: Crawley, Cameron & Selva (2016), Fig. 13.1.
Box 13.2 · Principle of Apparent Complexity
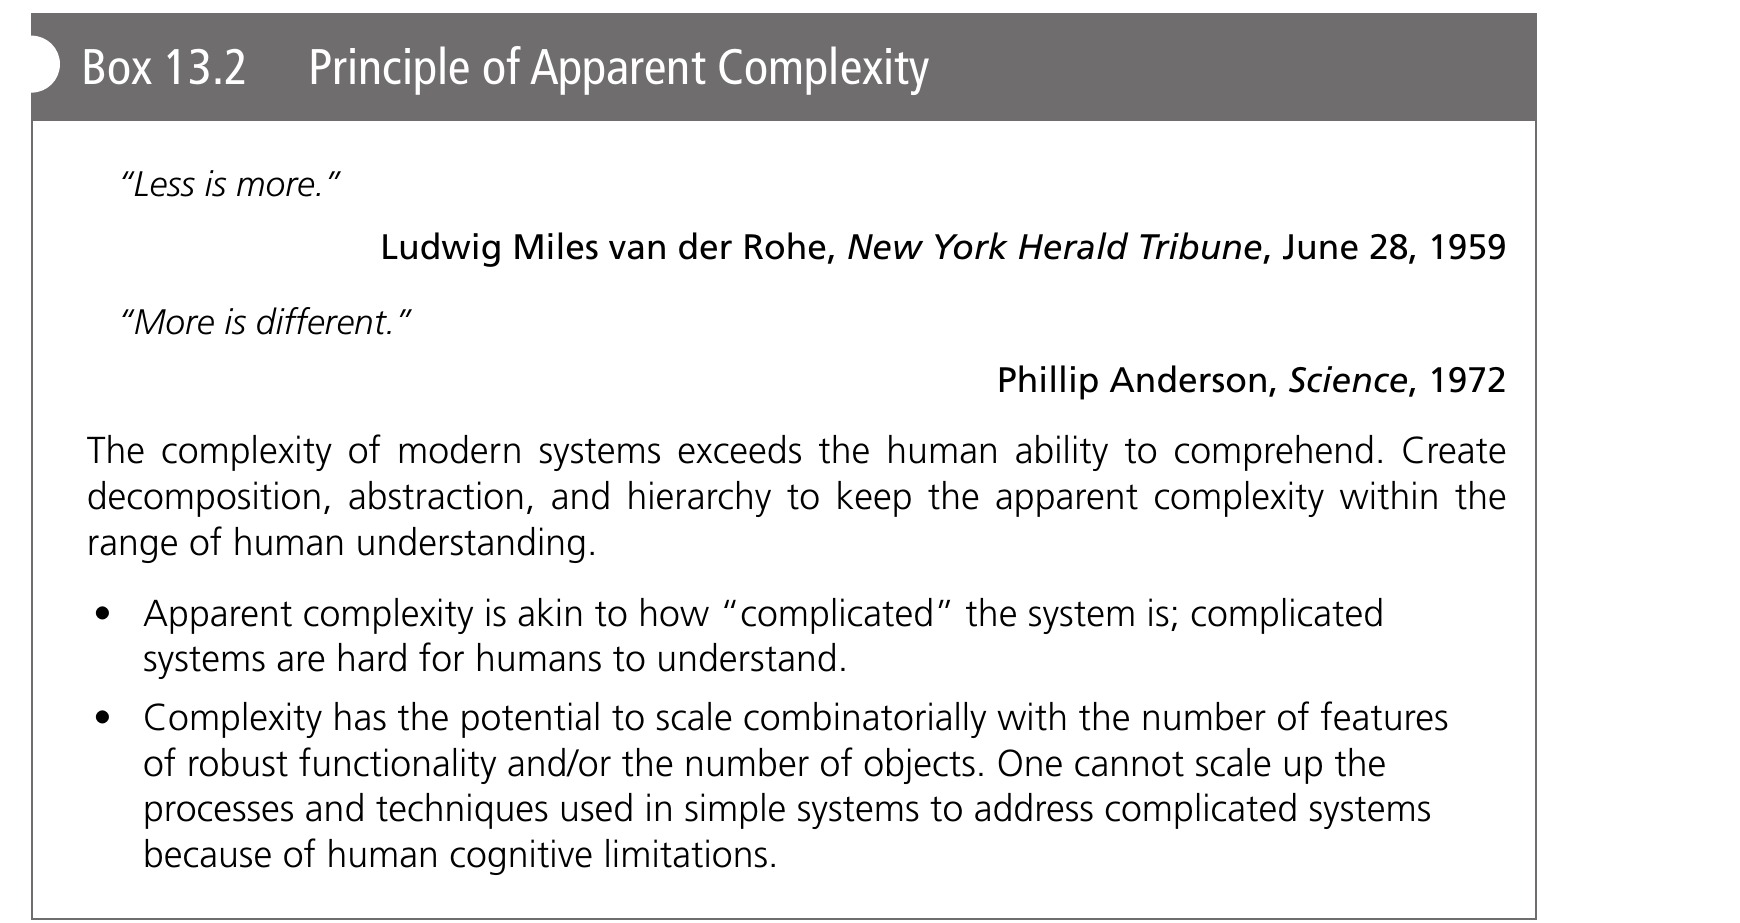
Figure 13.2 · Complicatedness in Civil Architecture
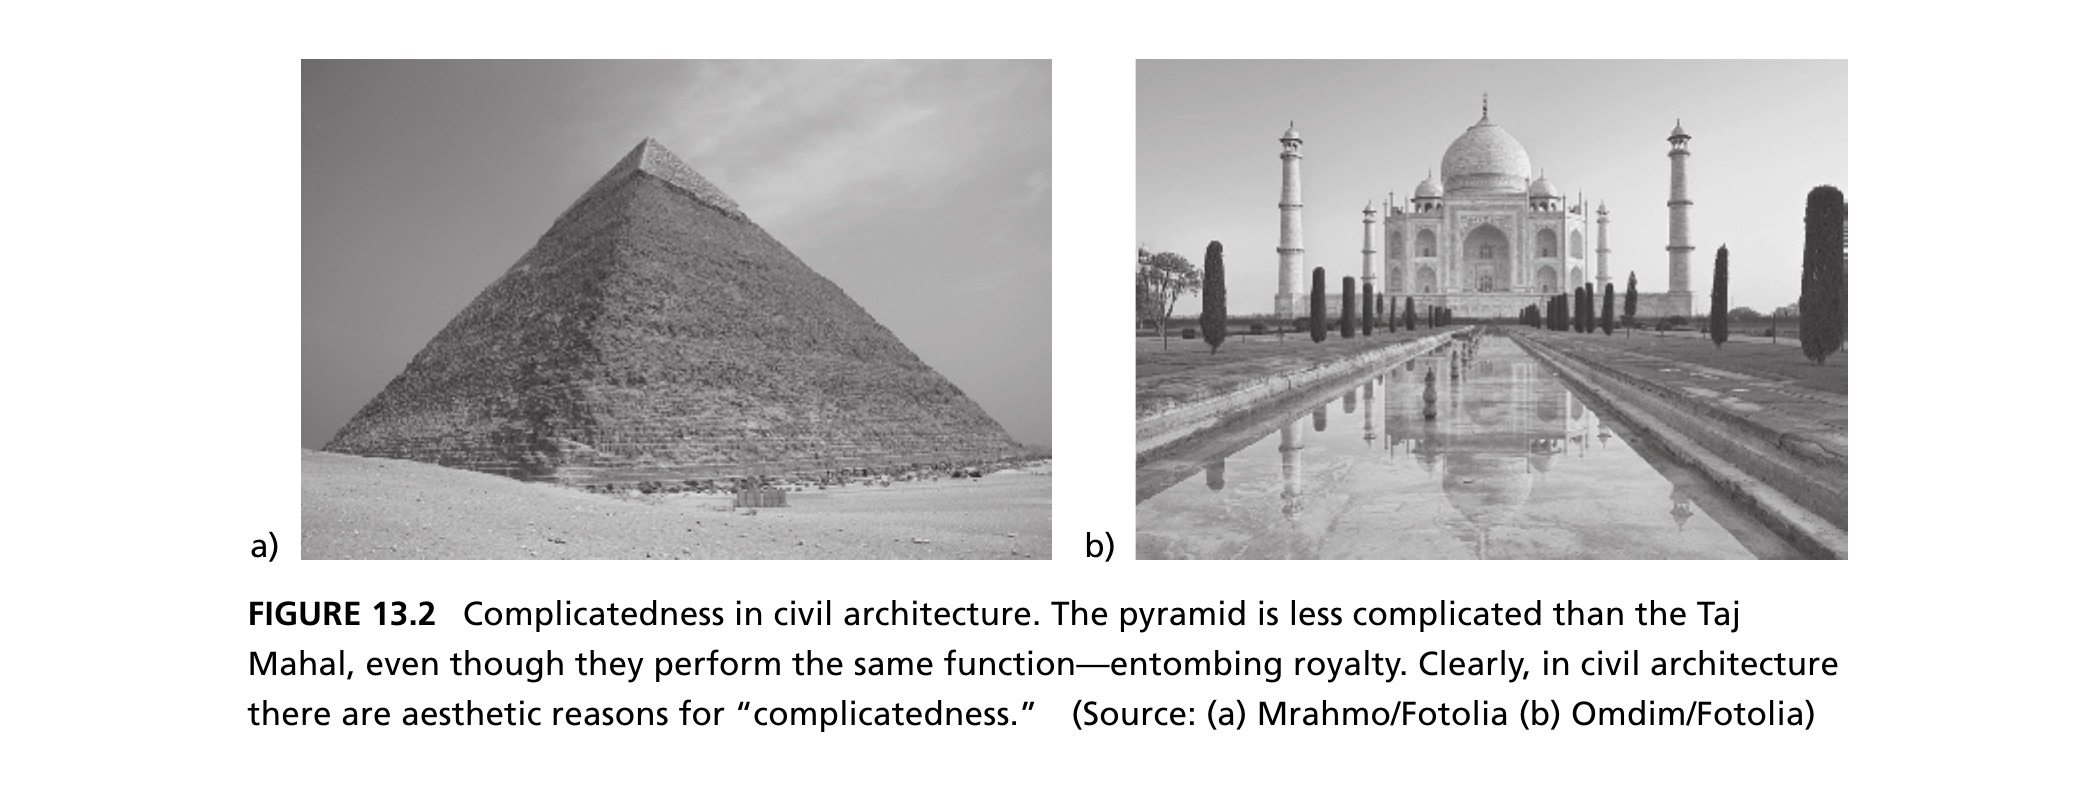
The pyramid is less complicated than the Taj Mahal, even though both perform the same function: entombing royalty. In civil architecture there are aesthetic reasons for “complicatedness.” Source: Crawley, Cameron & Selva (2016), Fig. 13.2.
Figure 13.3 · A Complicated Network
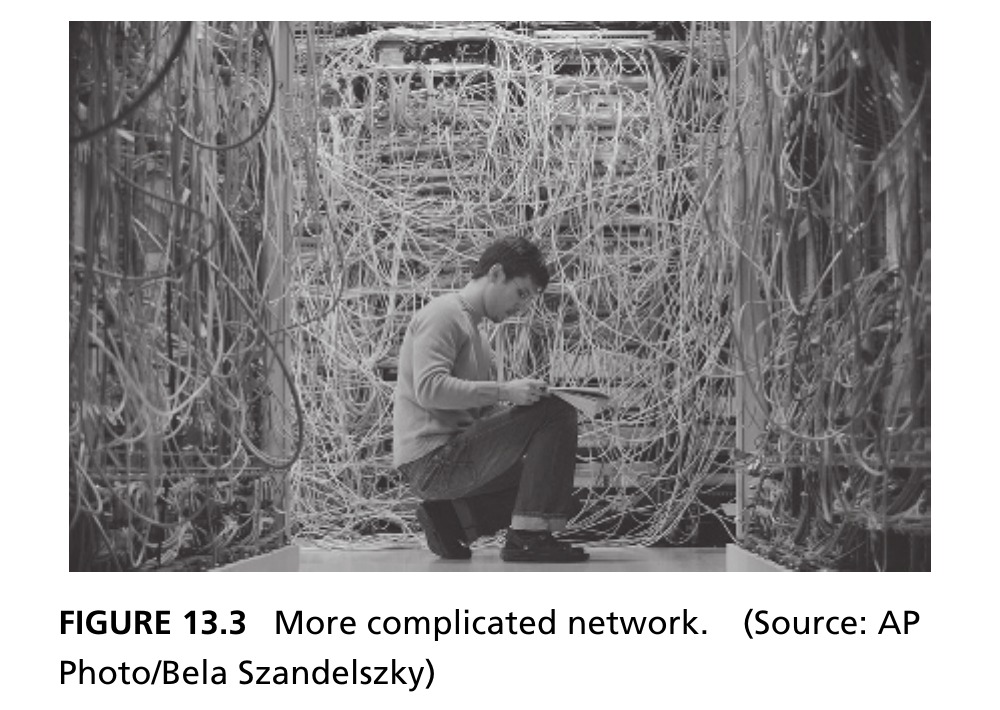
The same function is delivered by Figures 13.3 and 13.4, and the inputs/outputs at an electrical layer are identical: but one architecture is far less complicated and more amenable to analysis and modification. Source: Crawley, Cameron & Selva (2016), Fig. 13.3.
Figure 13.4 · The Same Network, Organized
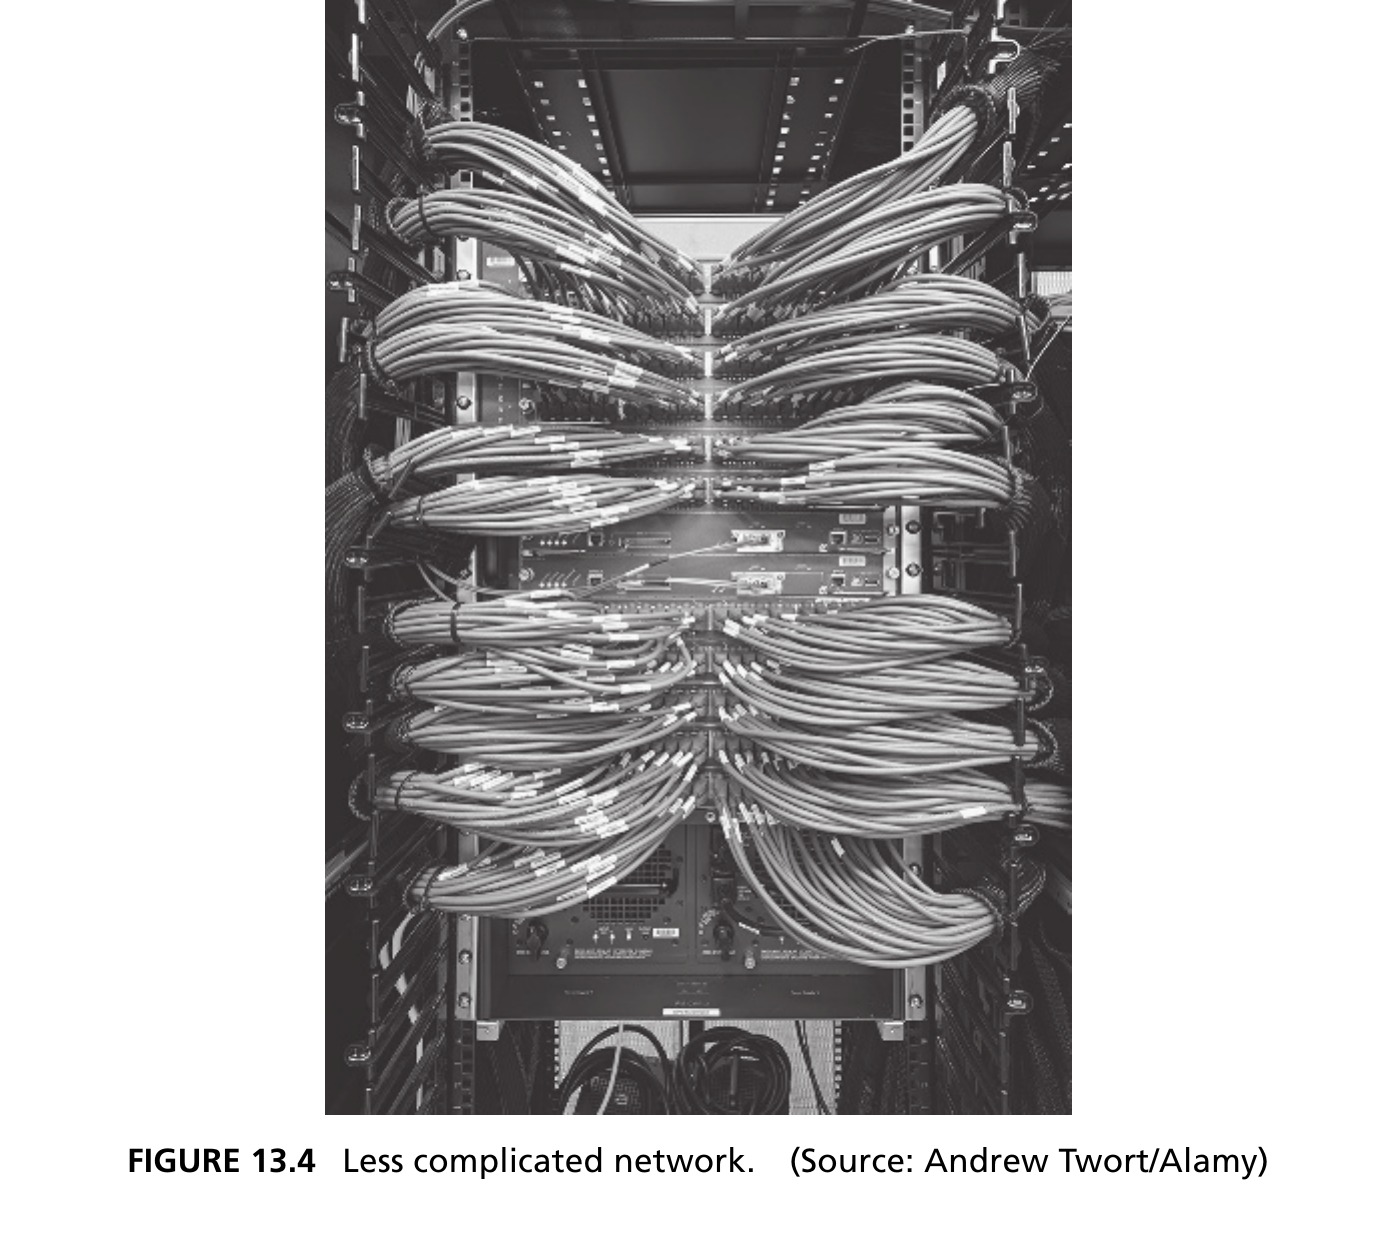
Decomposing the network into cables, routers, and racks, and abstracting a bundle of cables into a single “bus”, makes the organization legible without changing what the network does. Source: Crawley, Cameron & Selva (2016), Fig. 13.4.
Box 13.3 · Principle of Essential Complexity
Figure 13.5 · Is This Complexity Essential?
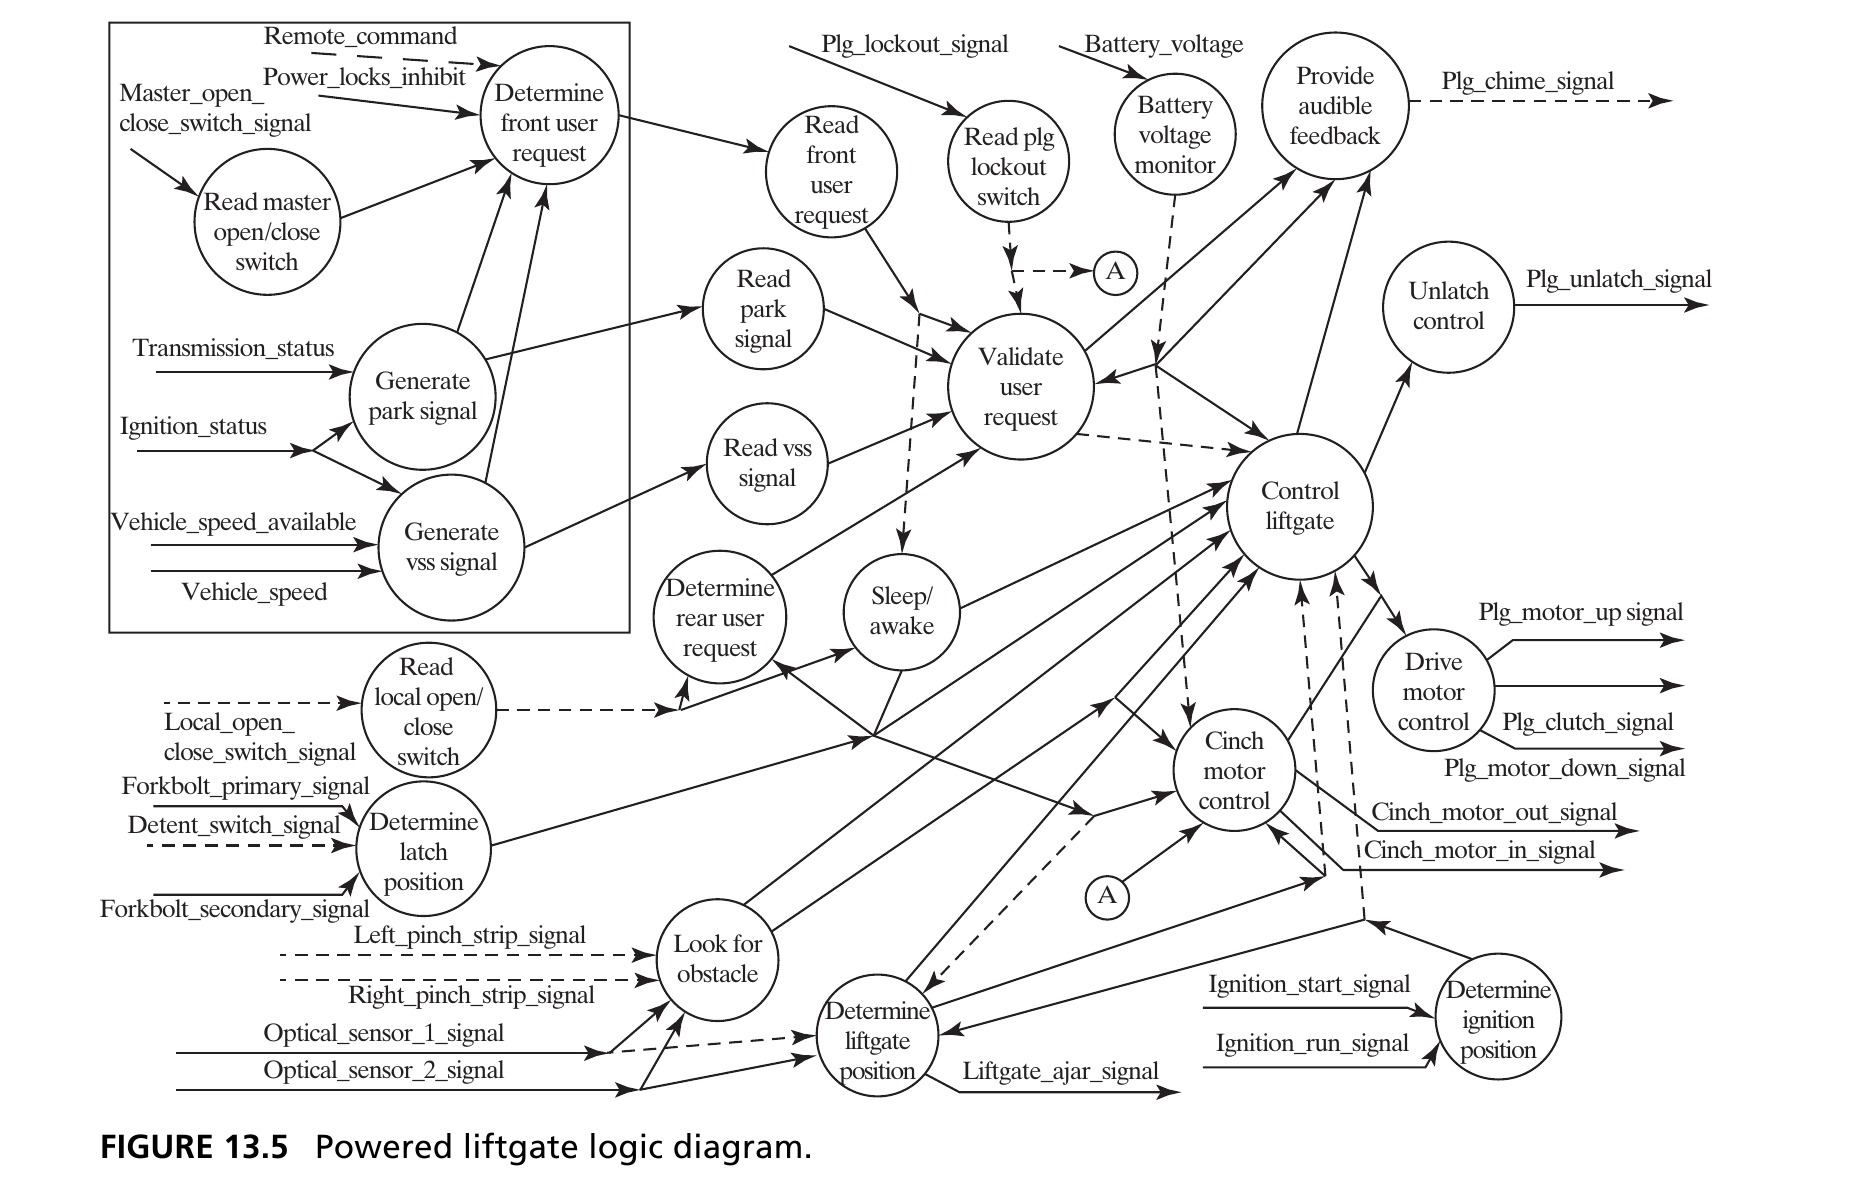
A powered liftgate’s logic: circles are processes, lines are signals. A minimum system (switch + reversing logic) wouldn’t capture the function that prevents opening while the vehicle moves. It’s hard to argue this diagram contains gratuitous functions or forms: but does it also carry gratuitous complexity inherited from legacy architectures? Source: Crawley, Cameron & Selva (2016), Fig. 13.5.
Figure 13.6 · Apparent ≠ Essential
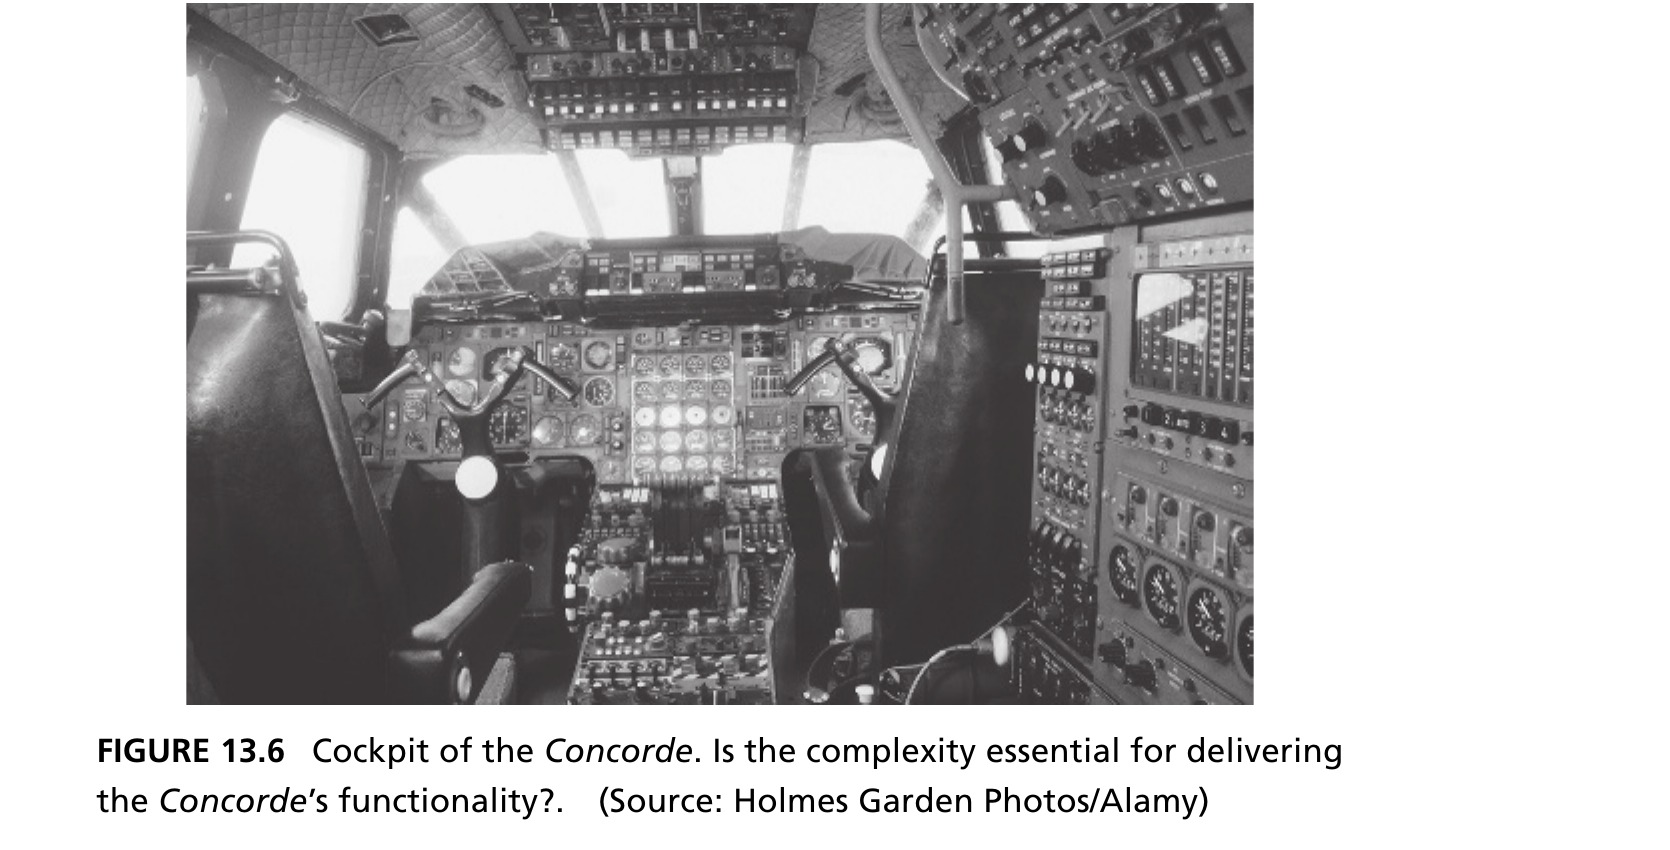
The Concorde flight deck required extensive training. Its appearance alone cannot establish which complexity was essential to the required performance with the available technology. Source: Crawley, Cameron & Selva (2016), Fig. 13.6.
Figure 13.7 · Low Apparent, High Actual
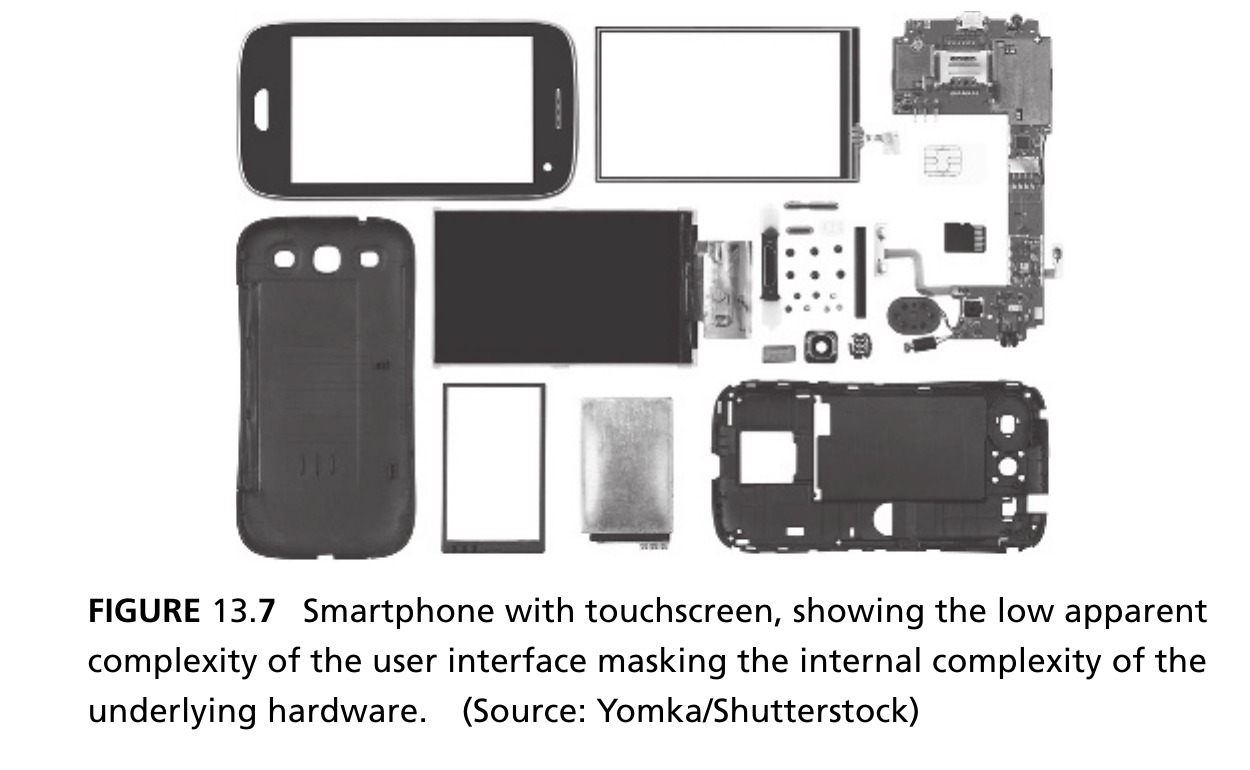
A touchscreen can conceal substantial internal hardware complexity. Assess that complexity against the phone’s required functions rather than its visible controls alone. Source: Crawley, Cameron & Selva (2016), Fig. 13.7.
Figure 13.8 · Decomposition Has a Price
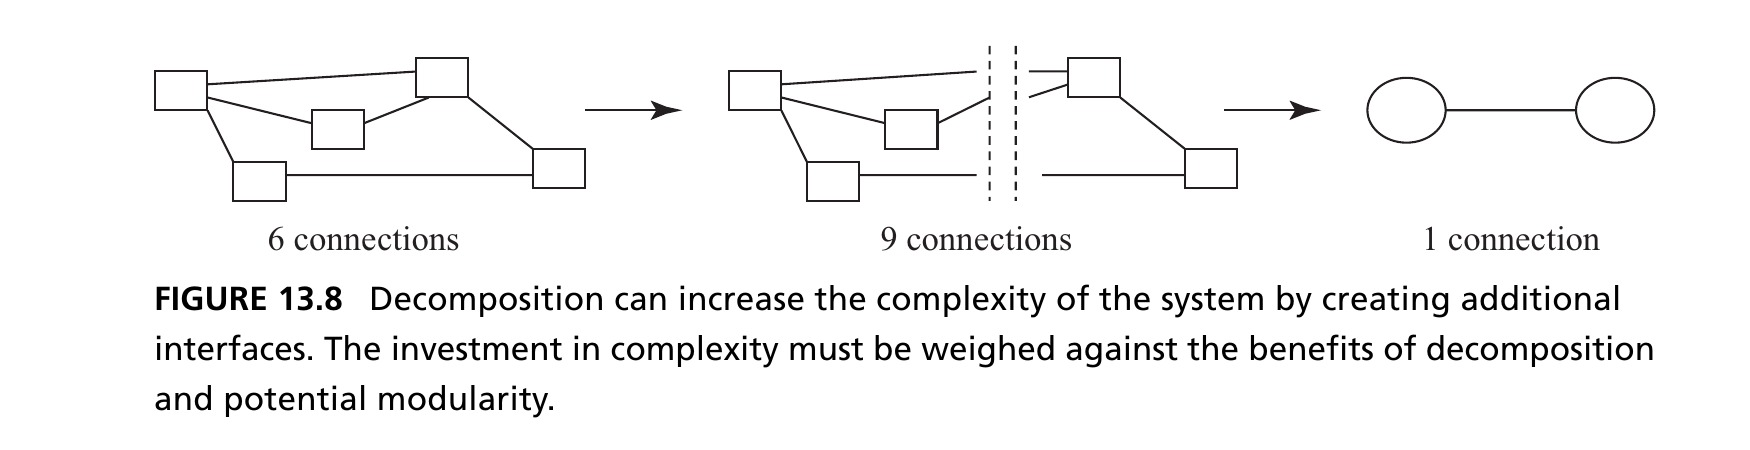
Five entities, six connections (left). Grouping into two clusters of three and two apparently simplifies the system to one connection (right): but the decomposition introduces an interface between the groups: the system now has six entities and nine connections (middle)! Reducing apparent complexity can increase actual complexity. Source: Crawley, Cameron & Selva (2016), Fig. 13.8.
- The architect must decide whether to invest in actual complexity (to bring down apparent complexity), or not to invest at all
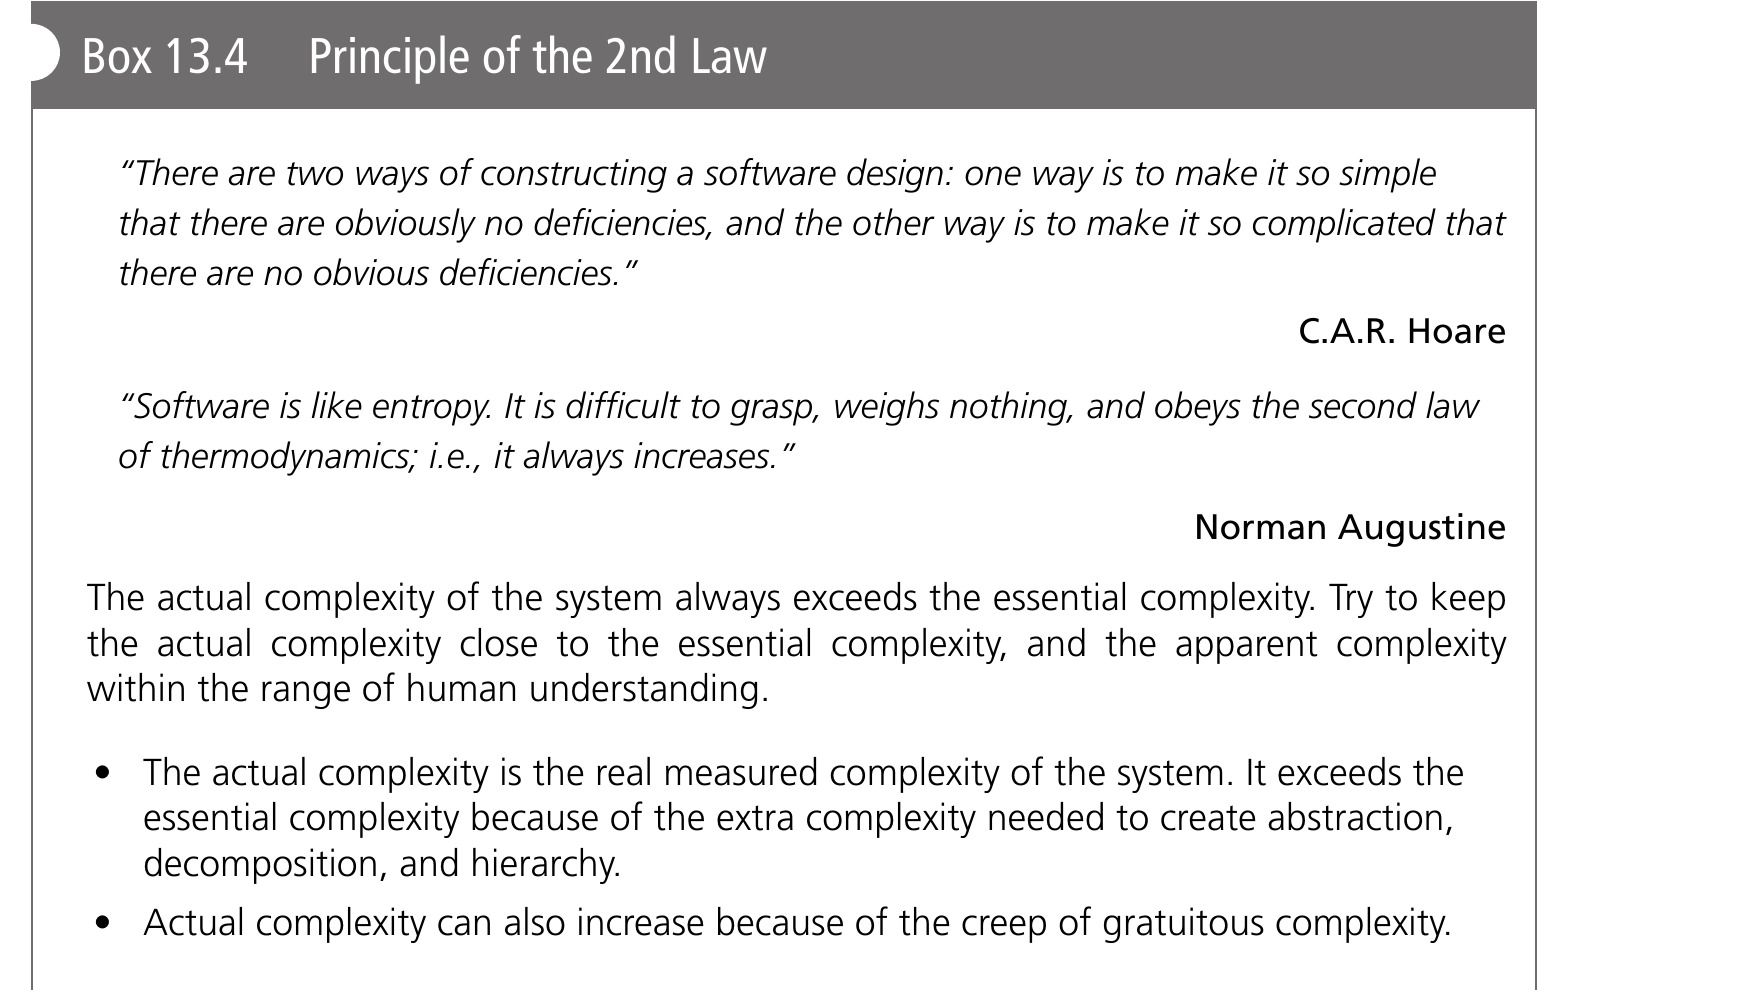
Box 13.4 · Principle of the 2nd Law
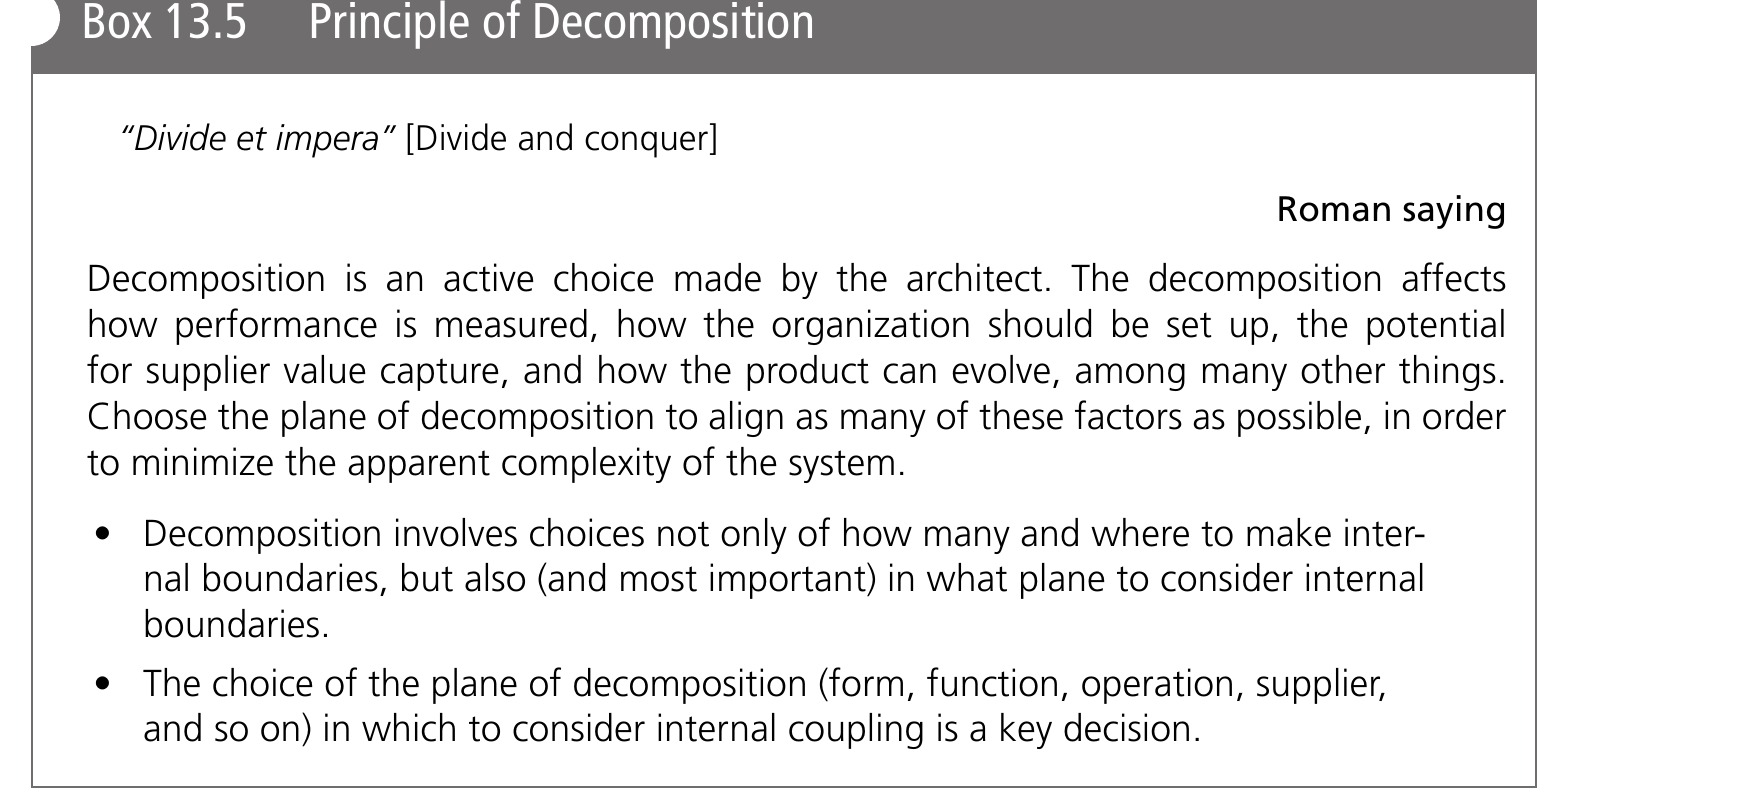
Box 13.5 · Principle of Decomposition
- A bad example: decomposing operations by nominal get-ready/get-set/go/get-unset/get-unready focuses on the typical case, omitting fault conditions, contingencies, and commissioning
Figure 13.9 · Illustration of “2 Down, 1 Up”
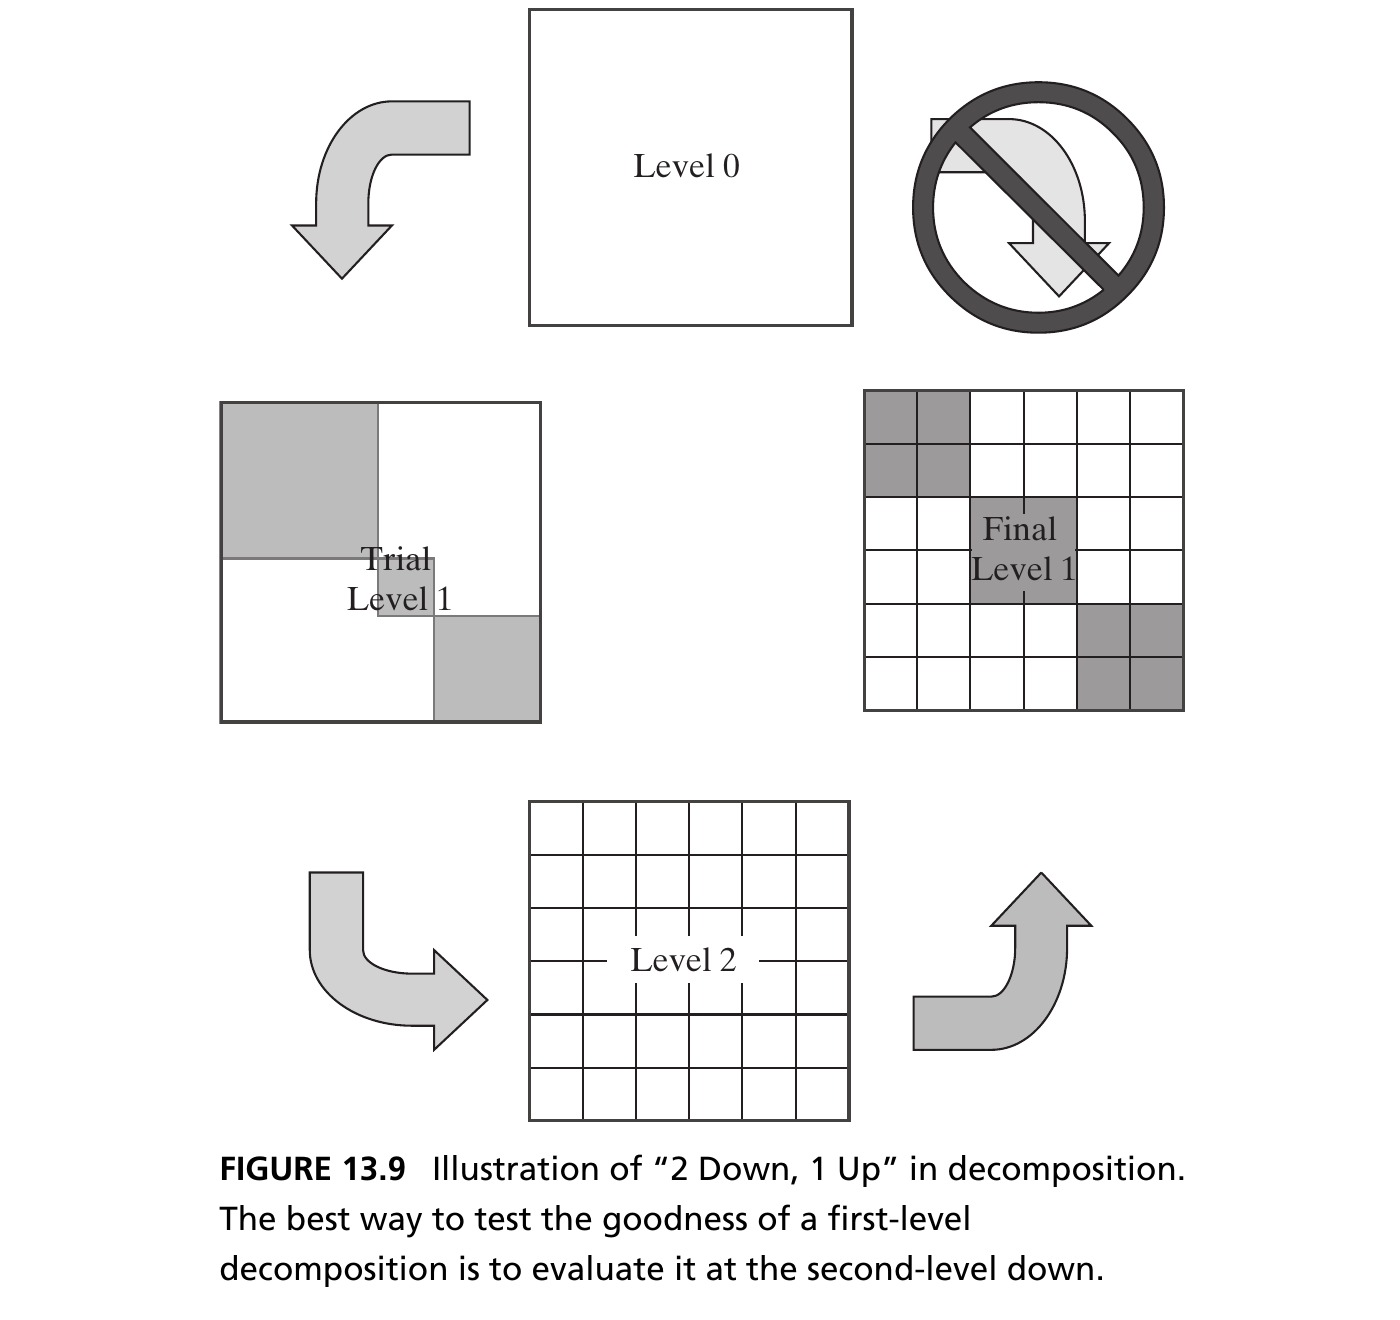
Box 13.6 · Principle of “2 Down, 1 Up”
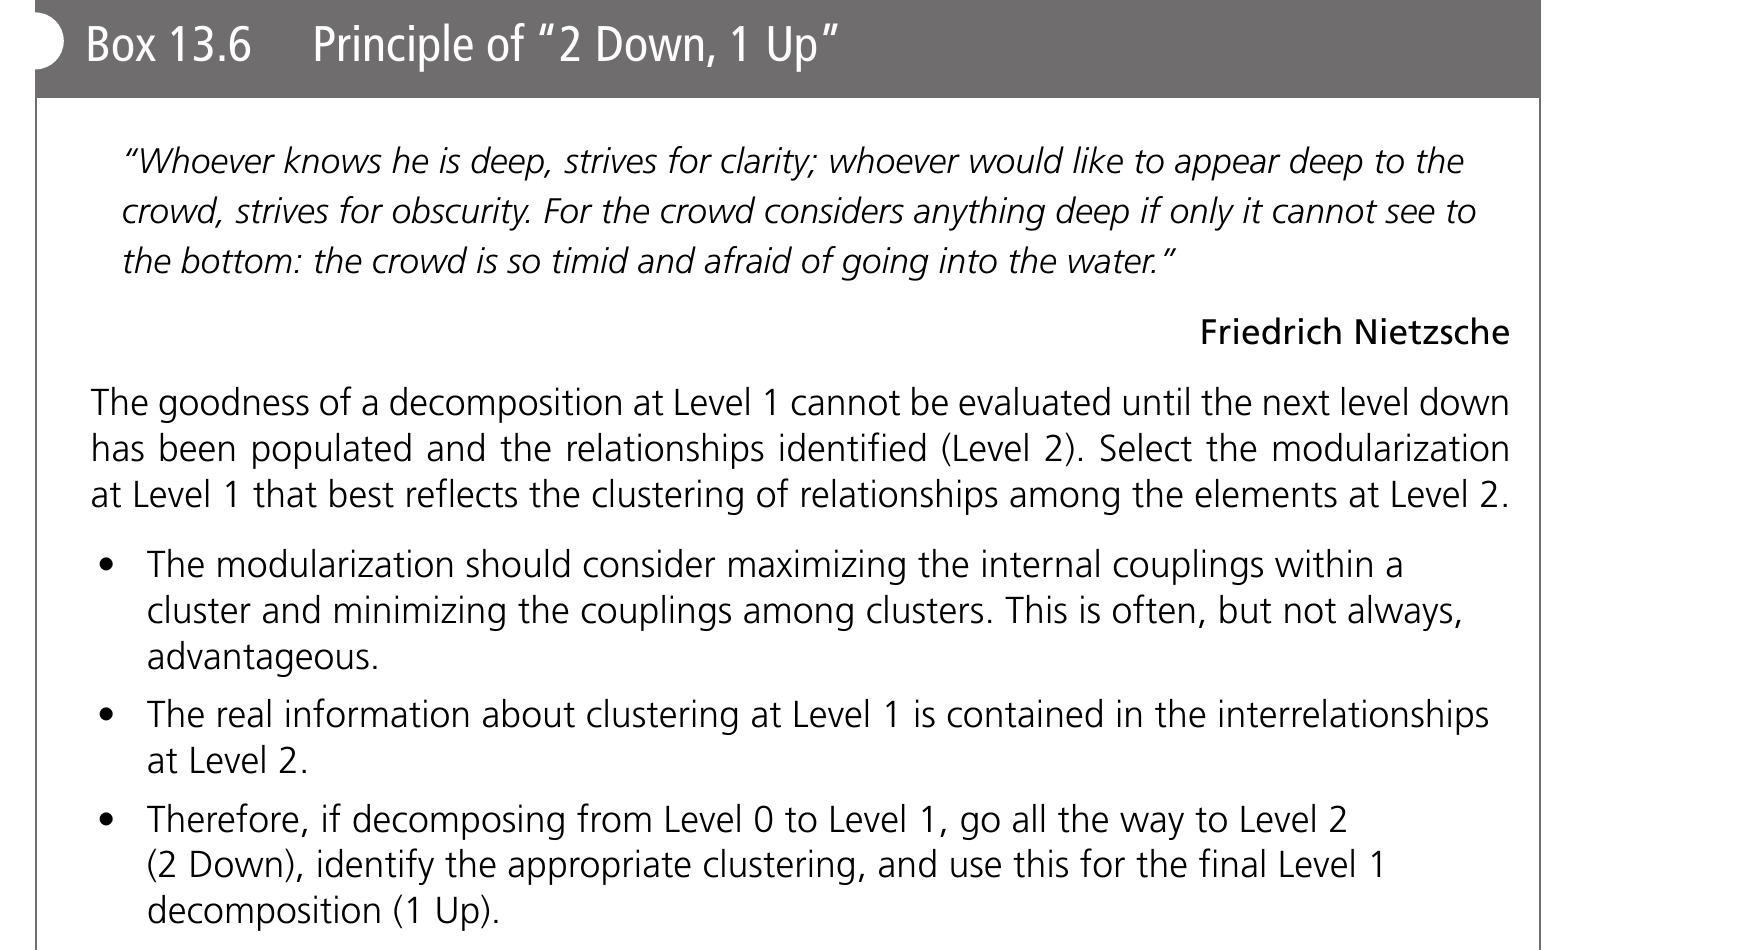
Figure 13.10 · Potential Decomposition Planes
Box 13.7 · Principle of Elegance
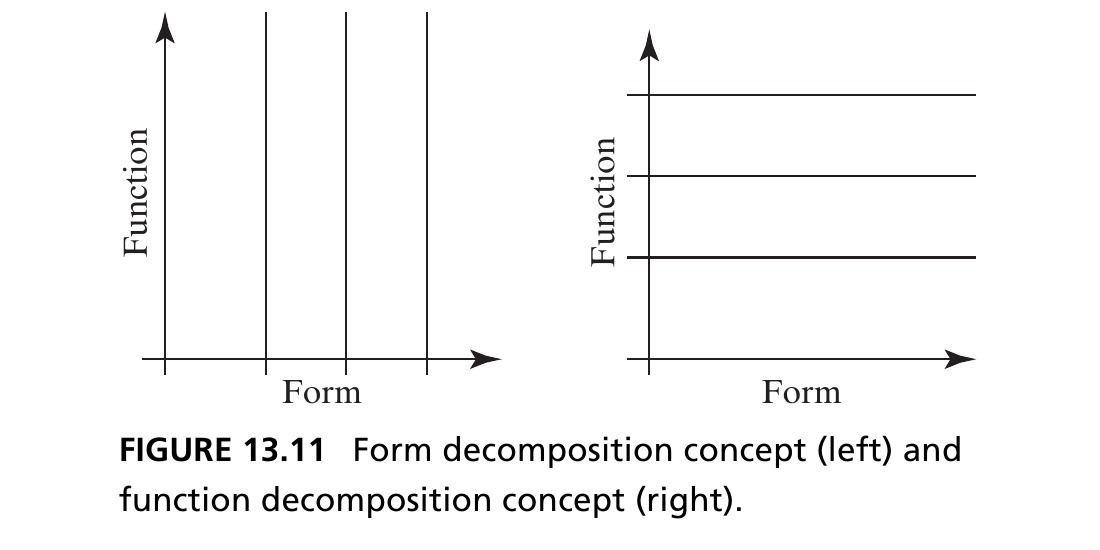
- The decomposition plane affects how functions, form, and interfaces fit together
Figure 13.11 · Form vs. Function
Saturn V: The Launch Vehicle
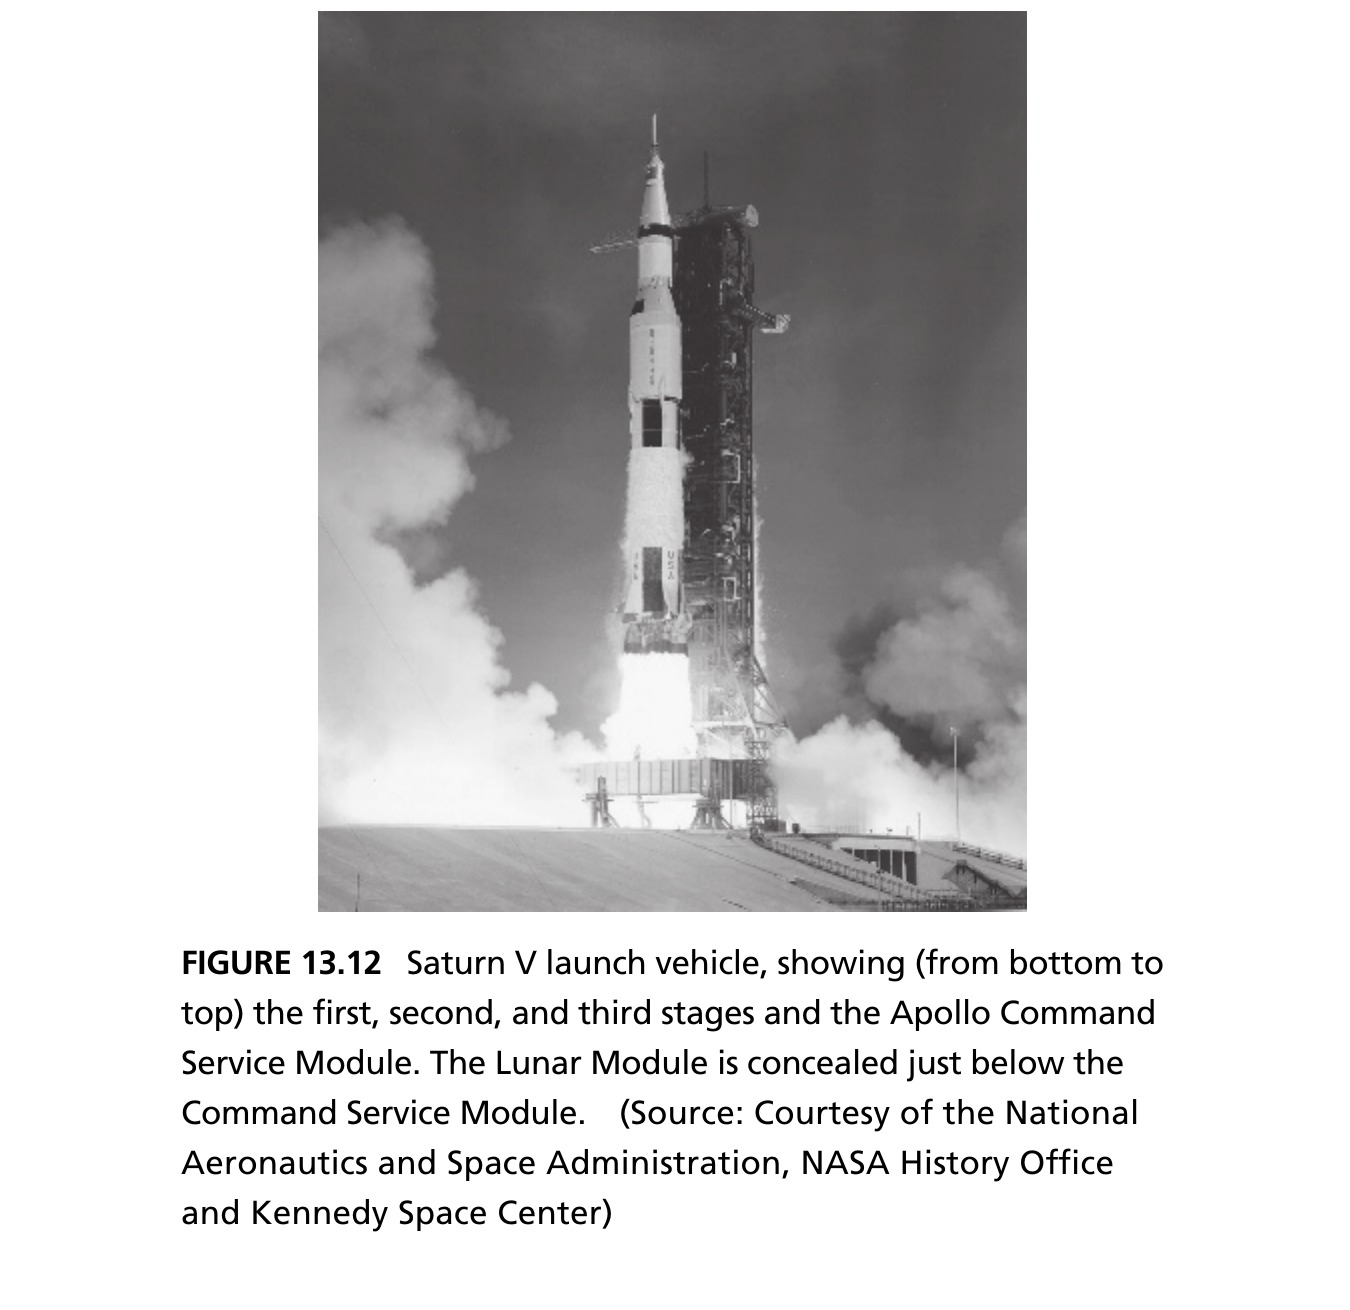
The Saturn V, developed by NASA 1962–1968, launched the Apollo Command Service Module, Lunar Module, and crew from Earth’s surface into orbit and toward the Moon. Its solution-neutral function: give the payload a change in velocity (Δv) through three stages. Source: Crawley, Cameron & Selva (2016), Fig. 13.12.
Space Station Freedom
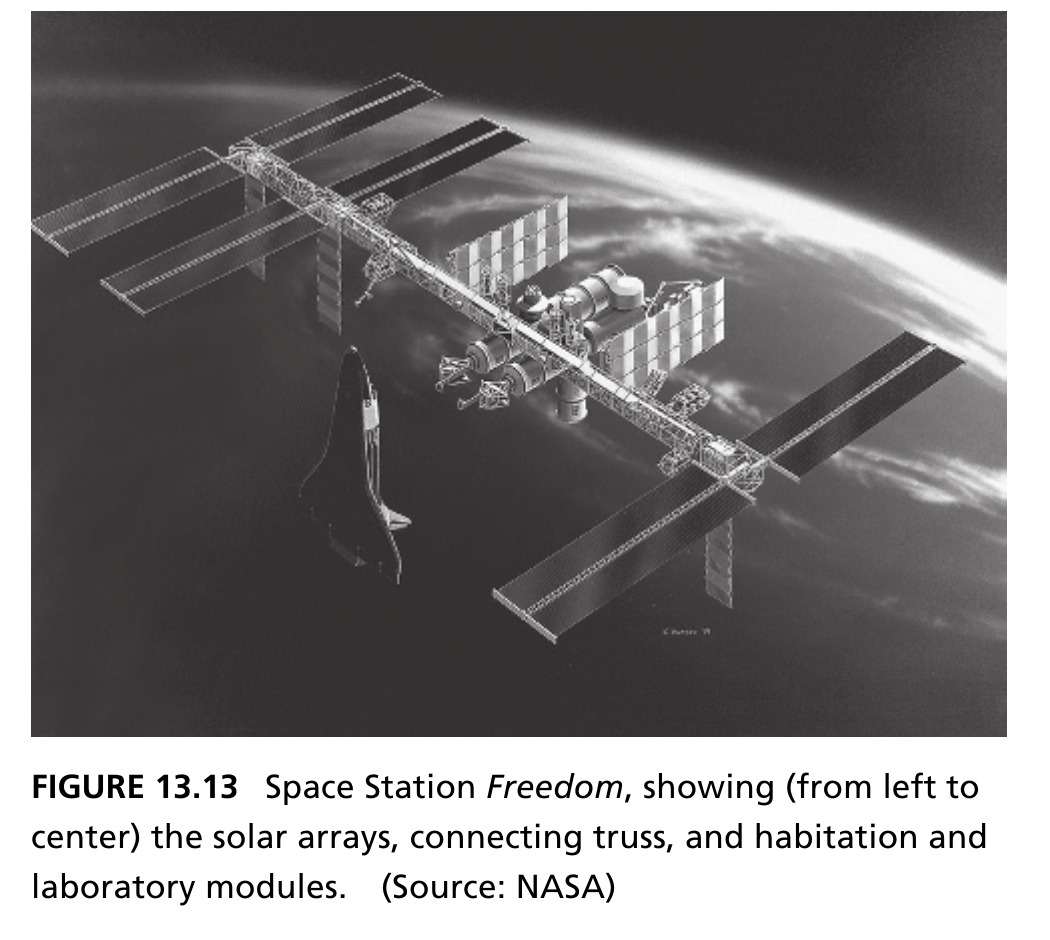
Space Station Freedom (SSF), a semi-permanent Earth-orbiting station announced in 1984, was never built: over a decade it underwent design changes and eventually evolved into the International Space Station (1993). Source: Crawley, Cameron & Selva (2016), Fig. 13.13.
- Solution-neutral function: a laboratory for micro-gravity science and Earth observation, a base for space operations, and, a strong Cold-War political function, cementing international relationships (elements from Europe, Canada, Japan)