Translating Needs into Goals
Systems Architecture · Chapter 11
Figure 11.1 · The Needs-to-Goals Framework
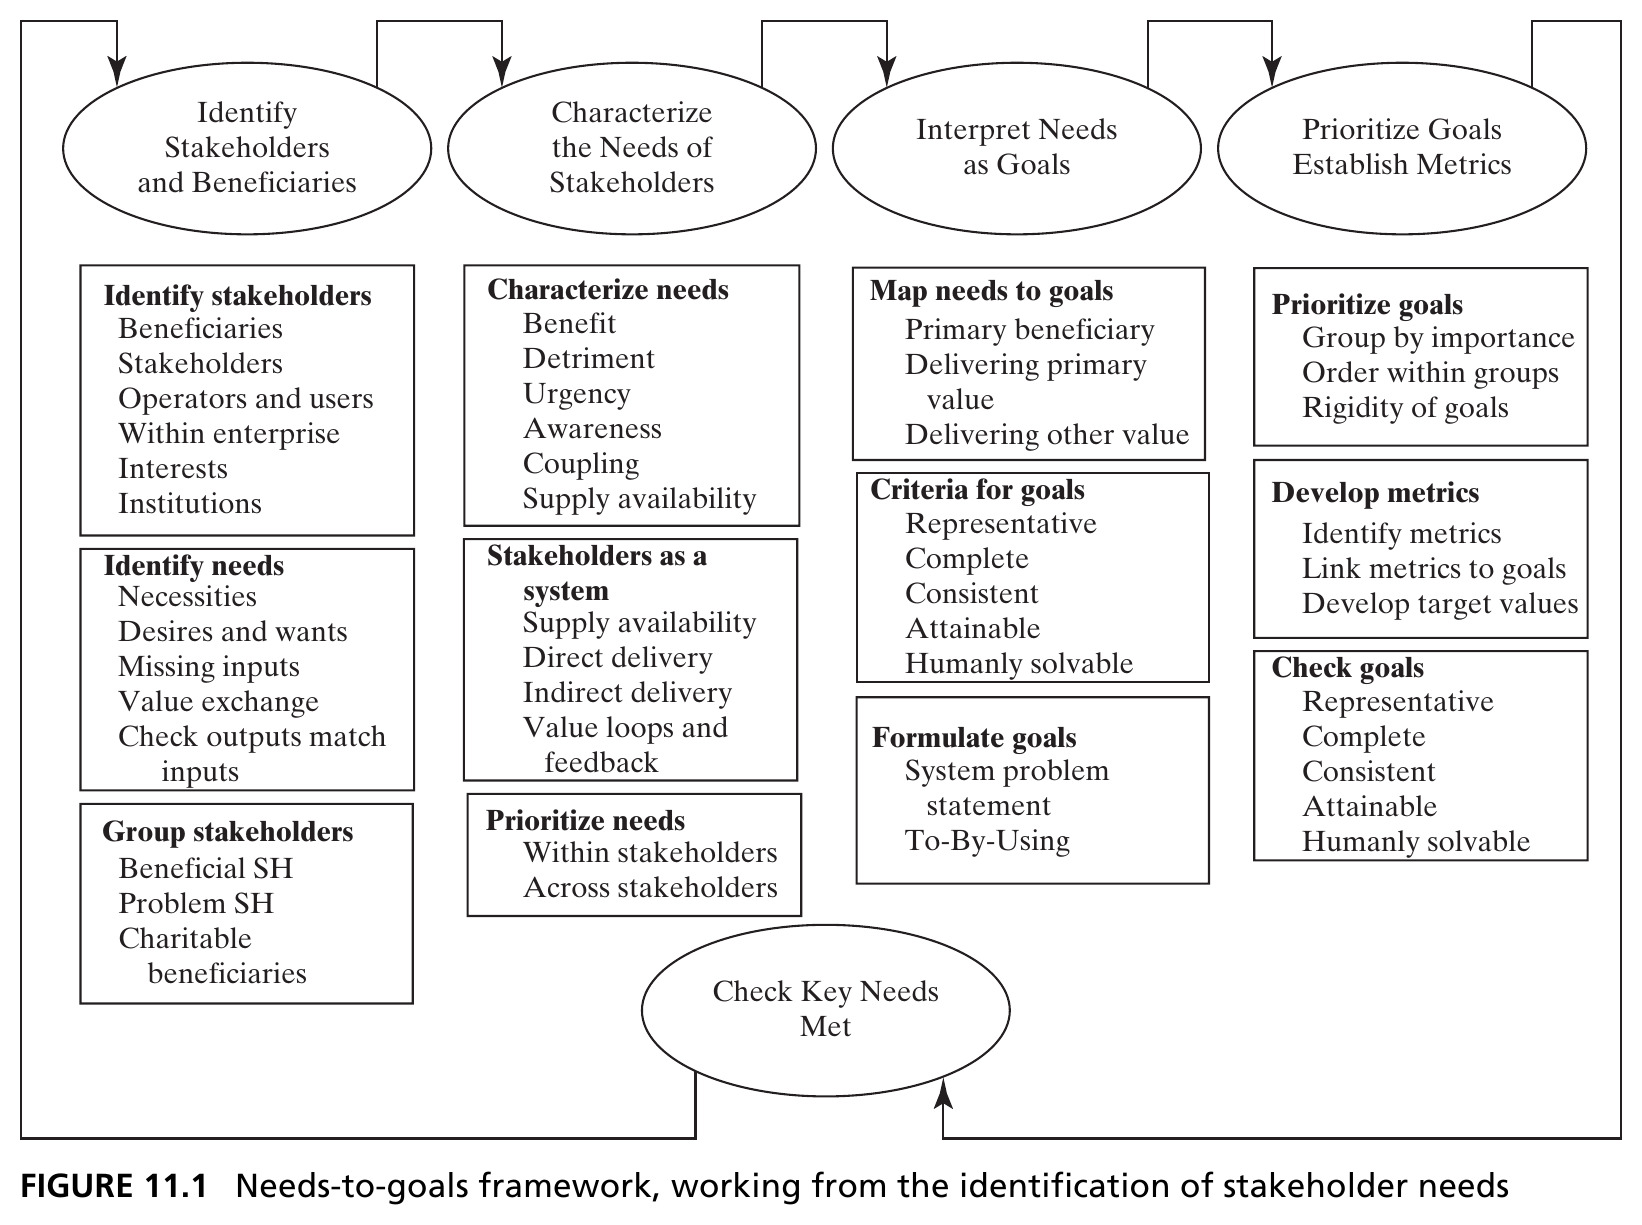
Four major steps: identify stakeholders and beneficiaries, characterize their needs, interpret needs as goals, and prioritize goals with metrics: closing the loop by checking key needs are met. Source: Crawley, Cameron & Selva (2016), Fig. 11.1.
Figure 11.2 · Stakeholders and Beneficiaries
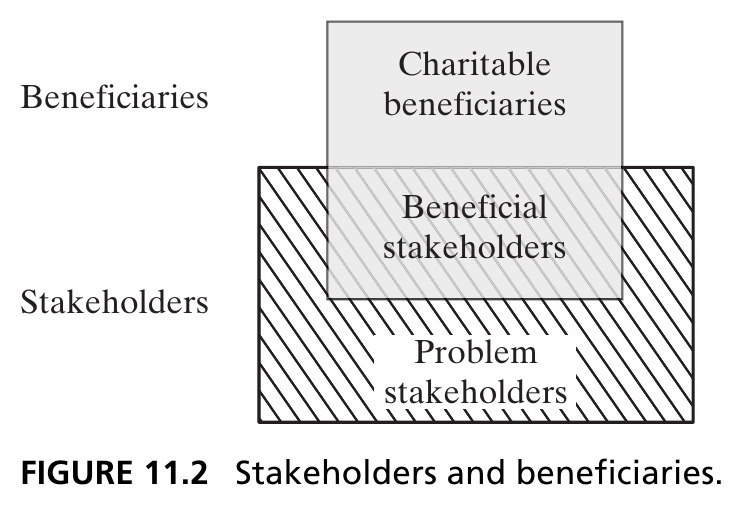
Beneficiaries are those whom the architecture addresses; you are important to them. Stakeholders have a stake in the outcome; they are important to you. Charitable beneficiaries are beneficiaries who aren’t also stakeholders. Source: Crawley, Cameron & Selva (2016), Fig. 11.2.
Figure 11.3 · Needs of the Beneficiaries for the Hybrid Car
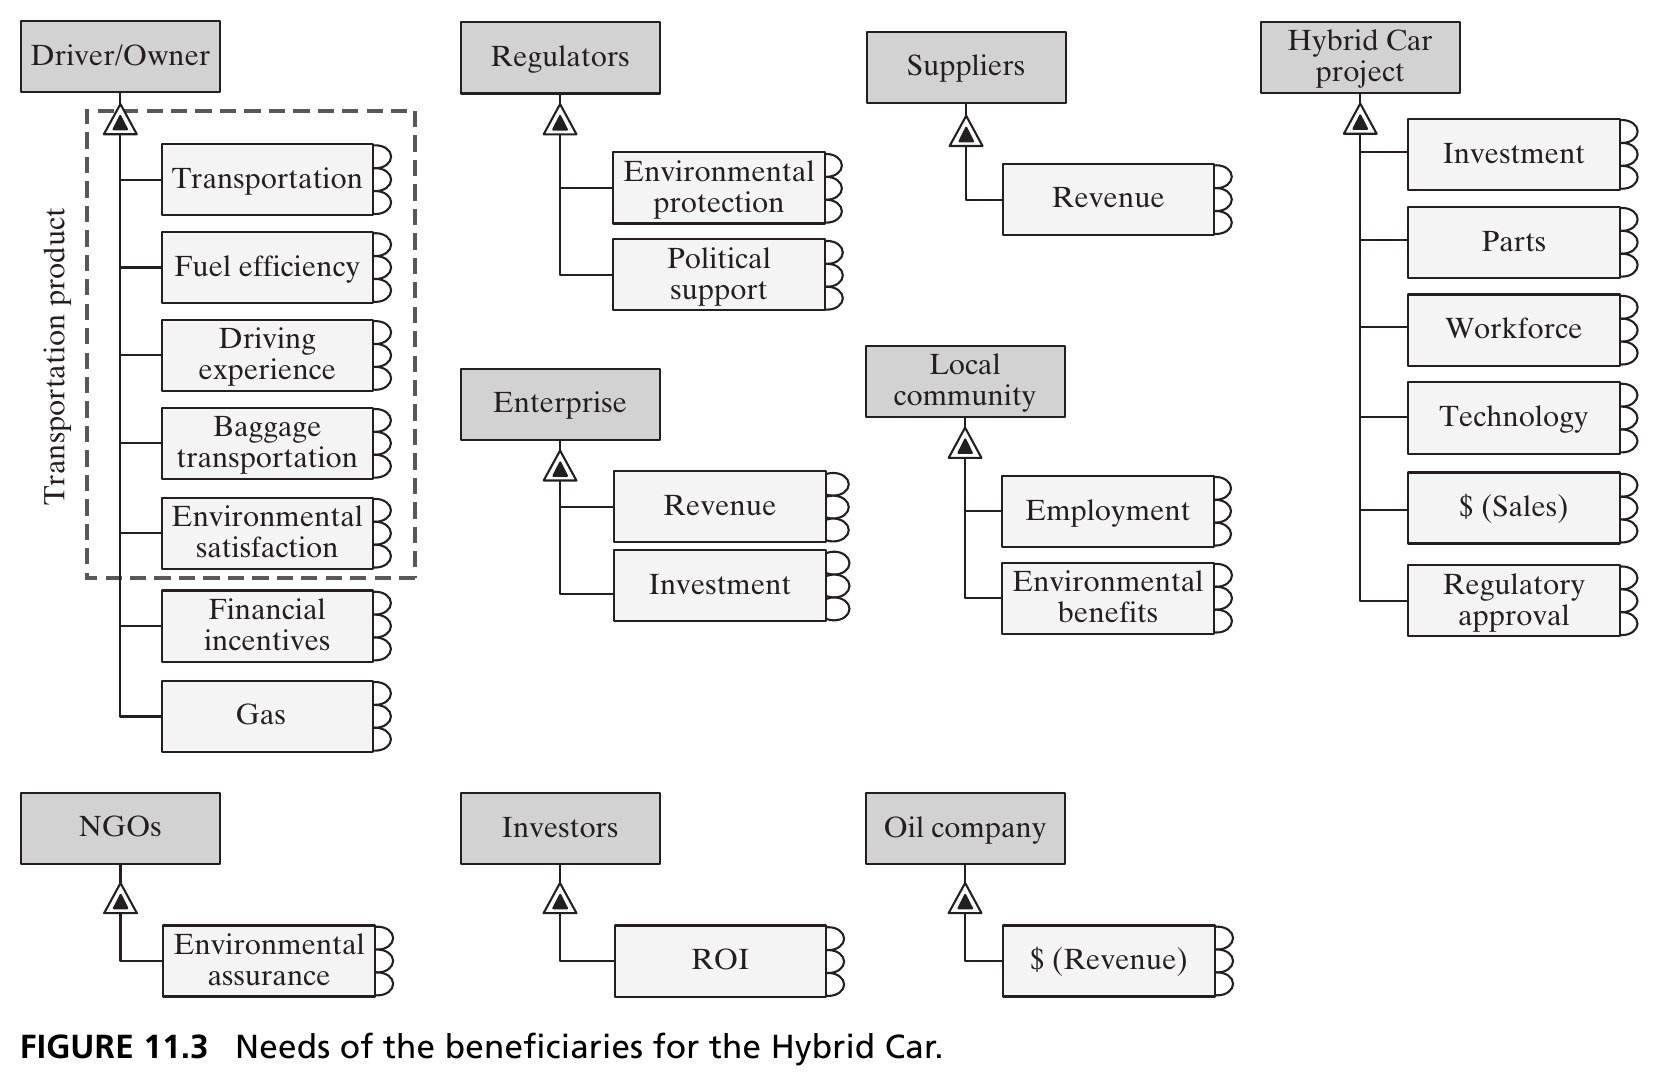
Starting with the primary beneficiary, the driver/owner, and their primary need (transportation), we work outward to the other stakeholders and their needs. Source: Crawley, Cameron & Selva (2016), Fig. 11.3.
Figure 11.4 · Needs Arise from an Exchange
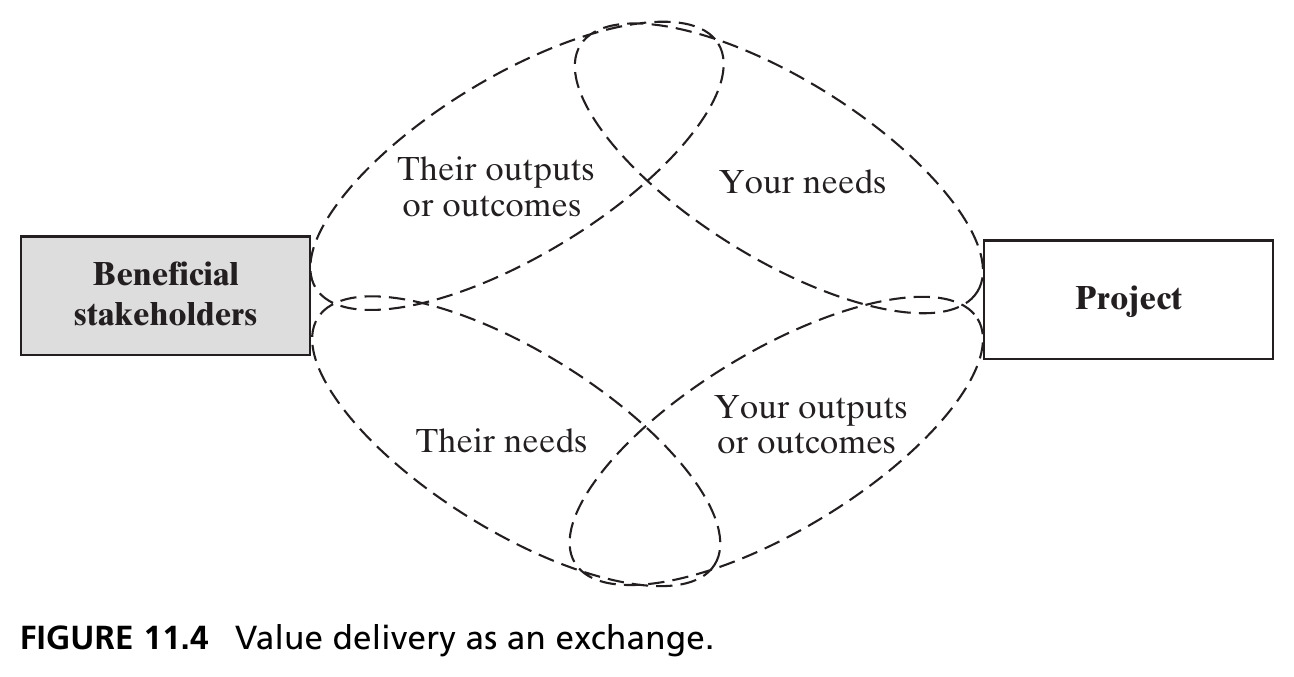
A central tenet of stakeholder theory: value results from an exchange. Your outputs satisfy their needs; their outputs satisfy yours. This completeness criterion helps surface additional stakeholders. Source: Crawley, Cameron & Selva (2016), Fig. 11.4.
Figure 11.5 · Grouping the Hybrid-Car Stakeholders
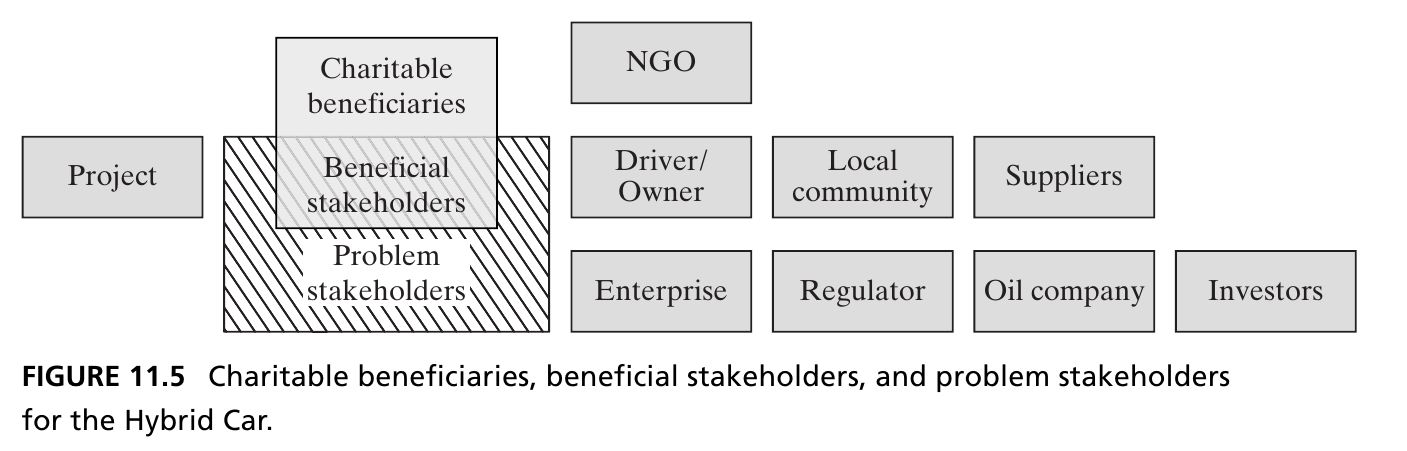
The NGO is a charitable beneficiary; the driver/owner, local community, and suppliers are beneficial stakeholders; the enterprise, regulator, oil company, and investors are classified as problem stakeholders in this initial view. Source: Crawley, Cameron & Selva (2016), Fig. 11.5.
Figure 11.6 · Stakeholder Prioritization for the Hybrid Car
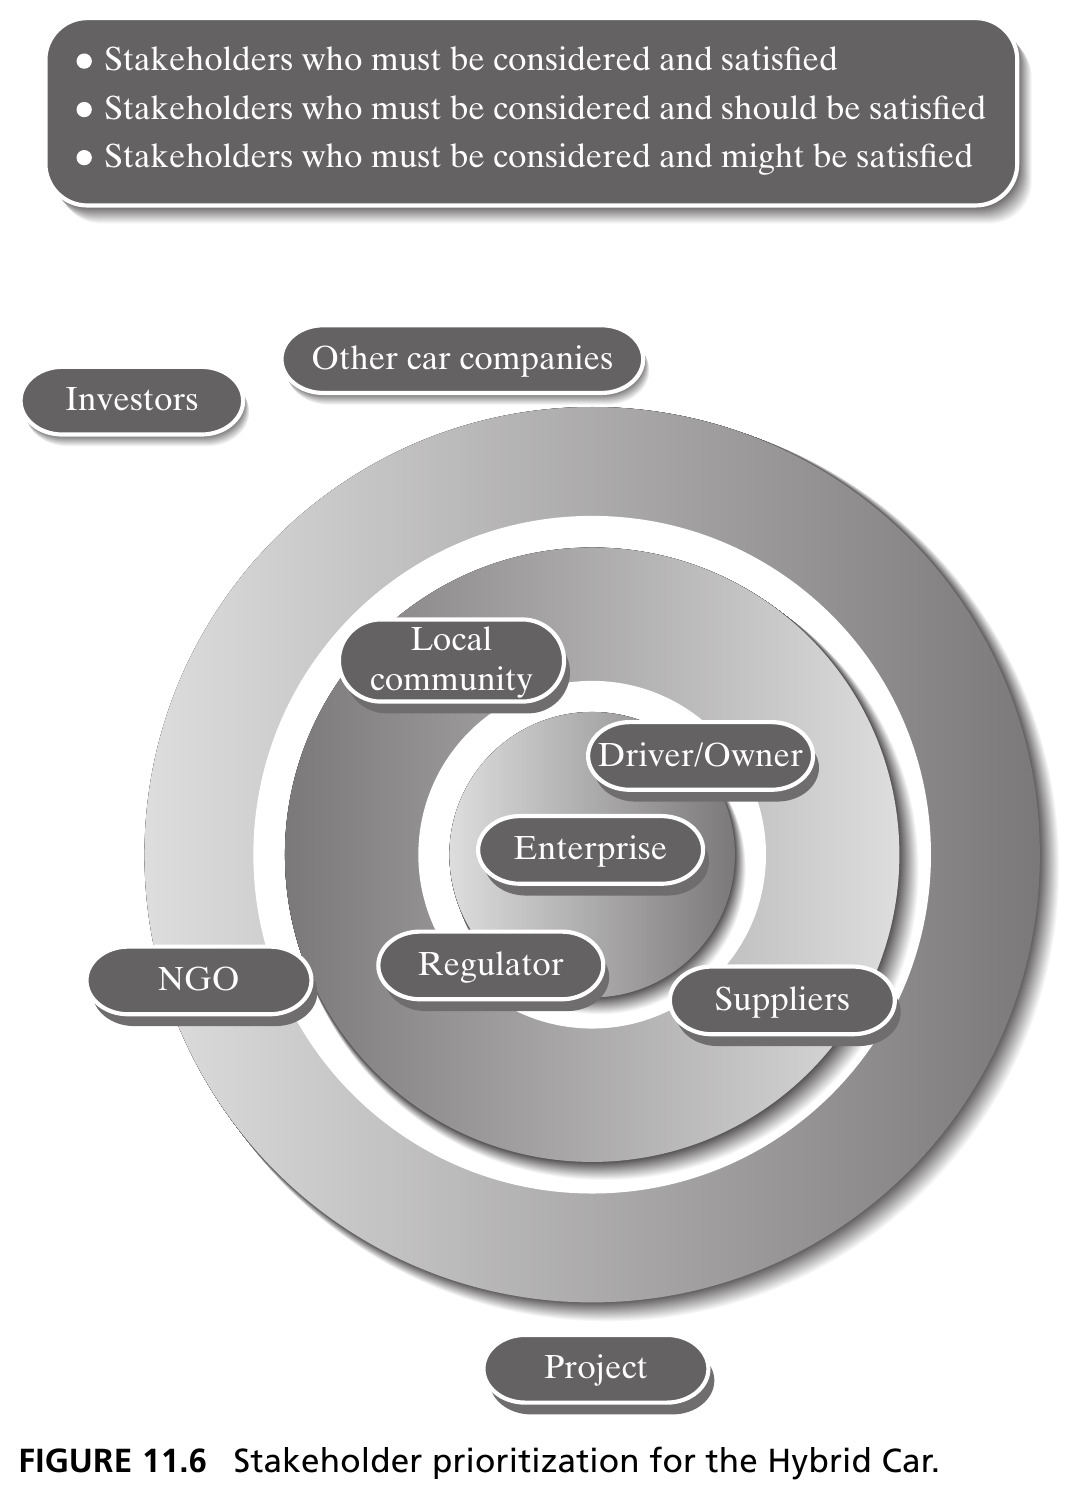
Concentric rings show the first-guess priority: enterprise and regulator innermost, then driver/owner and local community, then suppliers, NGOs, and investors: with other car companies and the project itself outside. Source: Crawley, Cameron & Selva (2016), Fig. 11.6.
Figure 11.7 · Kano Analysis
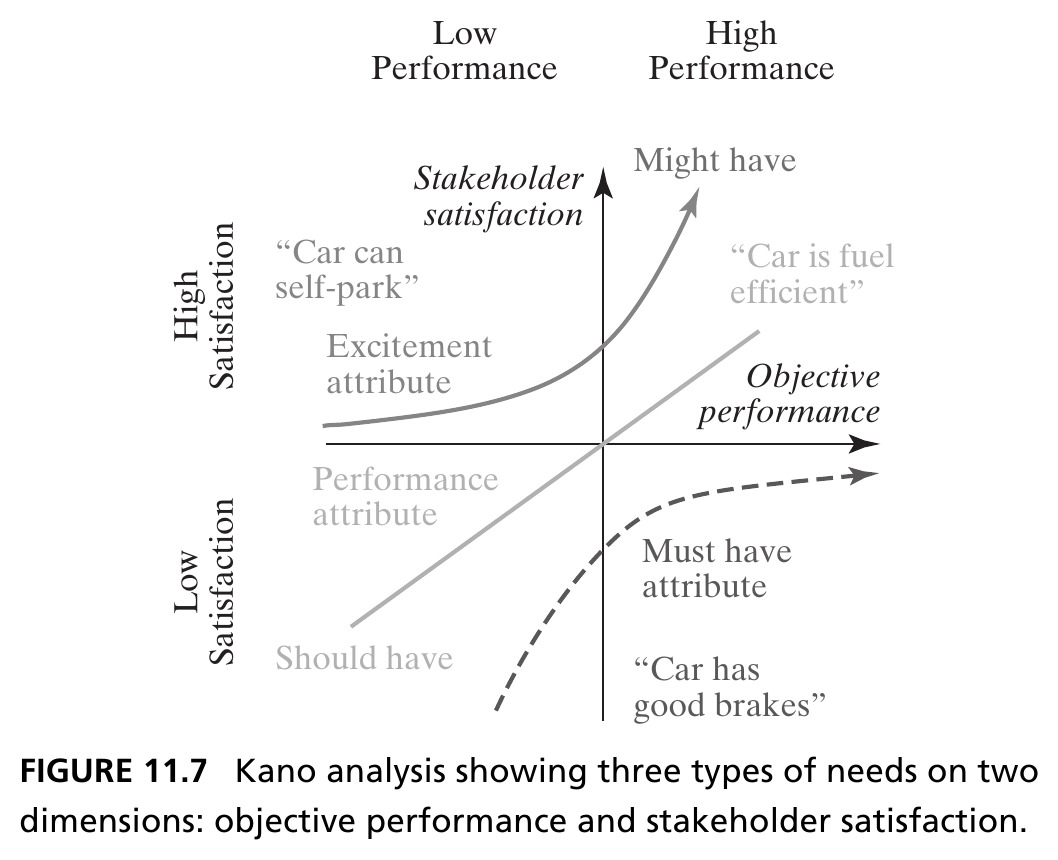
Three categories: Must have (unmet → strong dissatisfaction; met → no extra credit: “good brakes”), Should have (roughly linear satisfaction: “fuel efficient”), Might have (an excitement/delight attribute: “self-parking”). Categories shift over time as features become expected. Source: Crawley, Cameron & Selva (2016), Fig. 11.7.
Figure 11.8 · Hub-and-Spoke Stakeholder Map
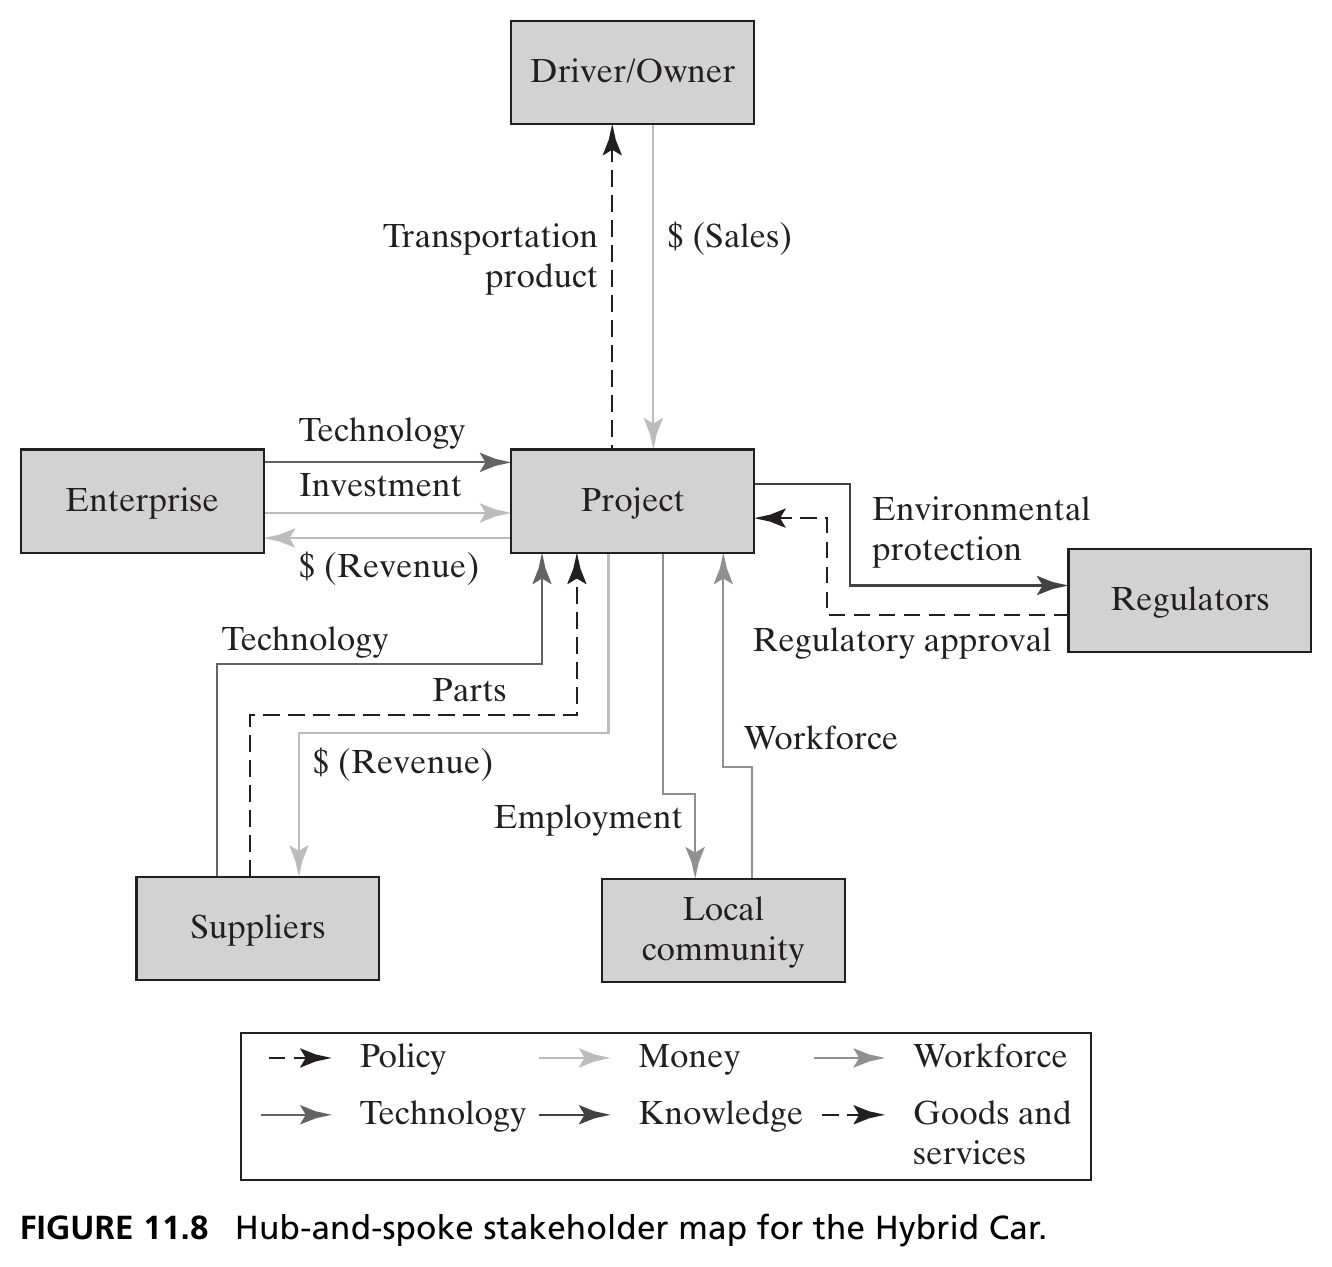
The project as hub, with flows to and from each stakeholder: six categories: policy, money, workforce, technology, knowledge, goods and services. Source: Crawley, Cameron & Selva (2016), Fig. 11.8.
Figure 11.9 · The Full Stakeholder Network
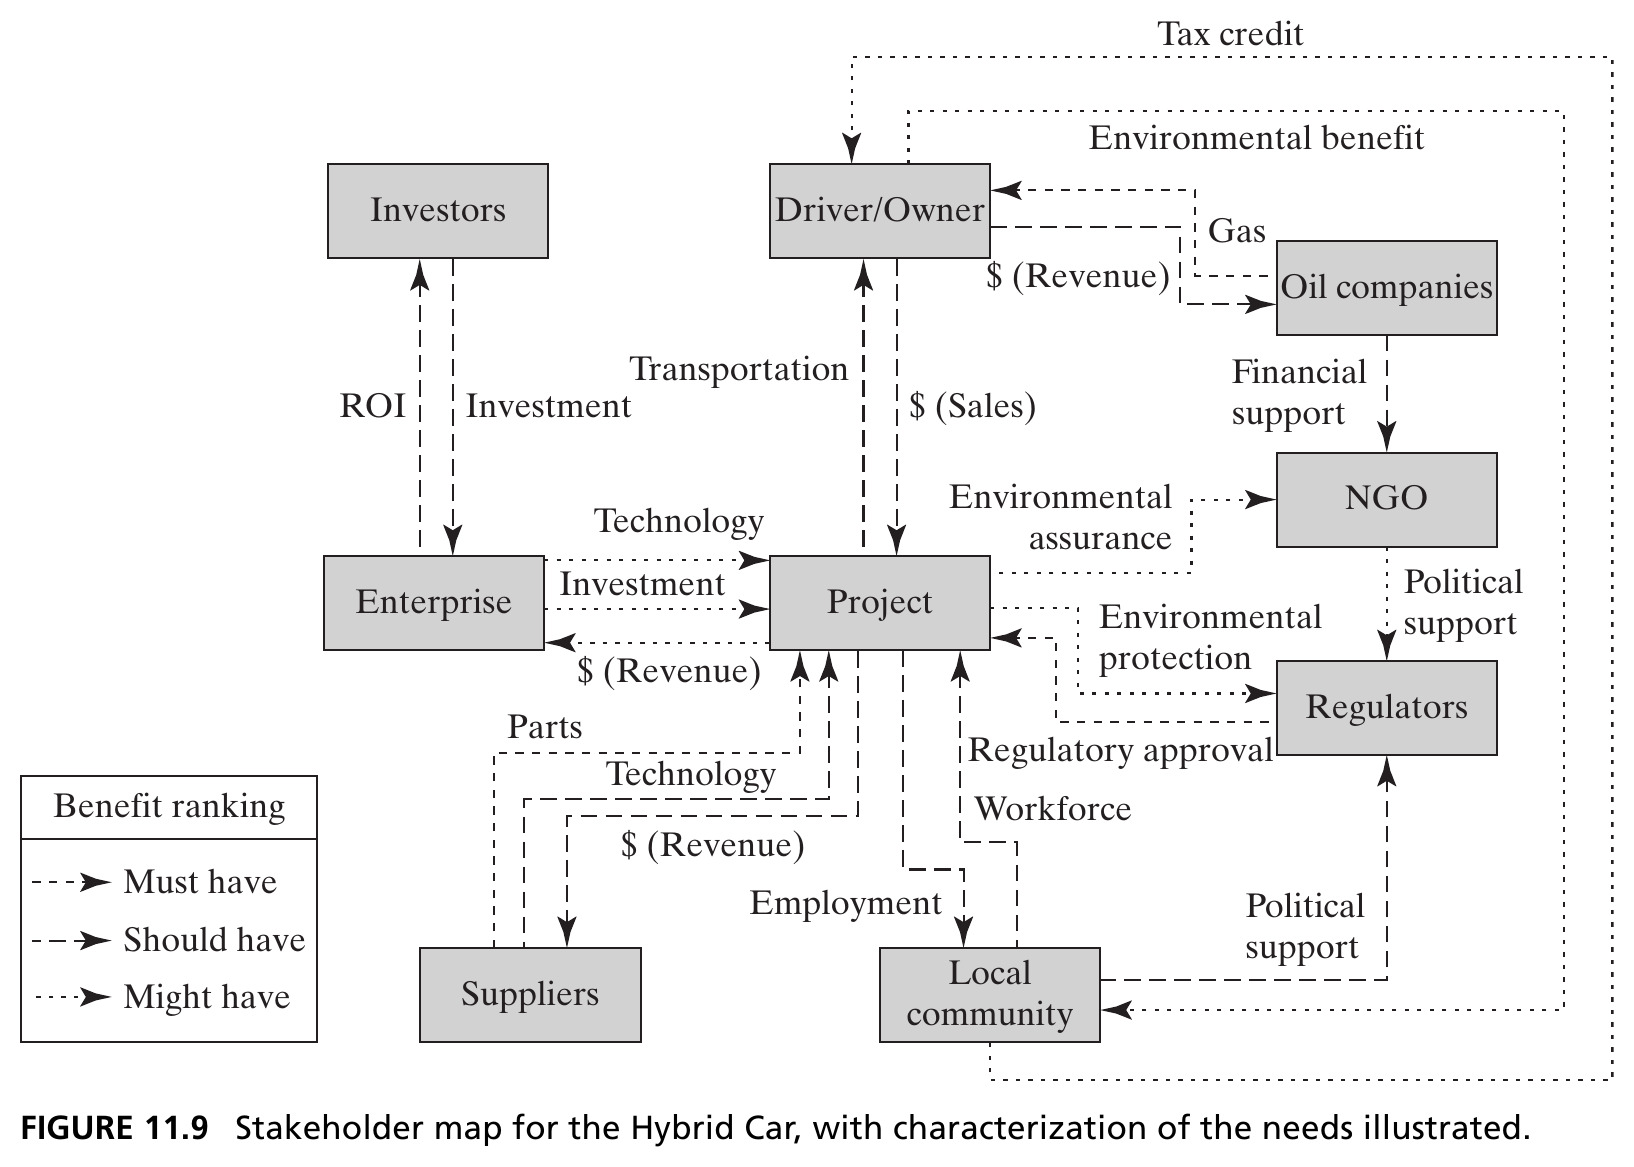
Pairing stakeholders combinatorially reveals indirect transactions: like the tax credit flowing from local community to driver/owner. NGOs, oil companies, and investors appear here even though they were absent from the hub-and-spoke view, because they don’t transact directly with the project. Source: Crawley, Cameron & Selva (2016), Fig. 11.9.
Figure 11.10 · Availability of Alternative Suppliers
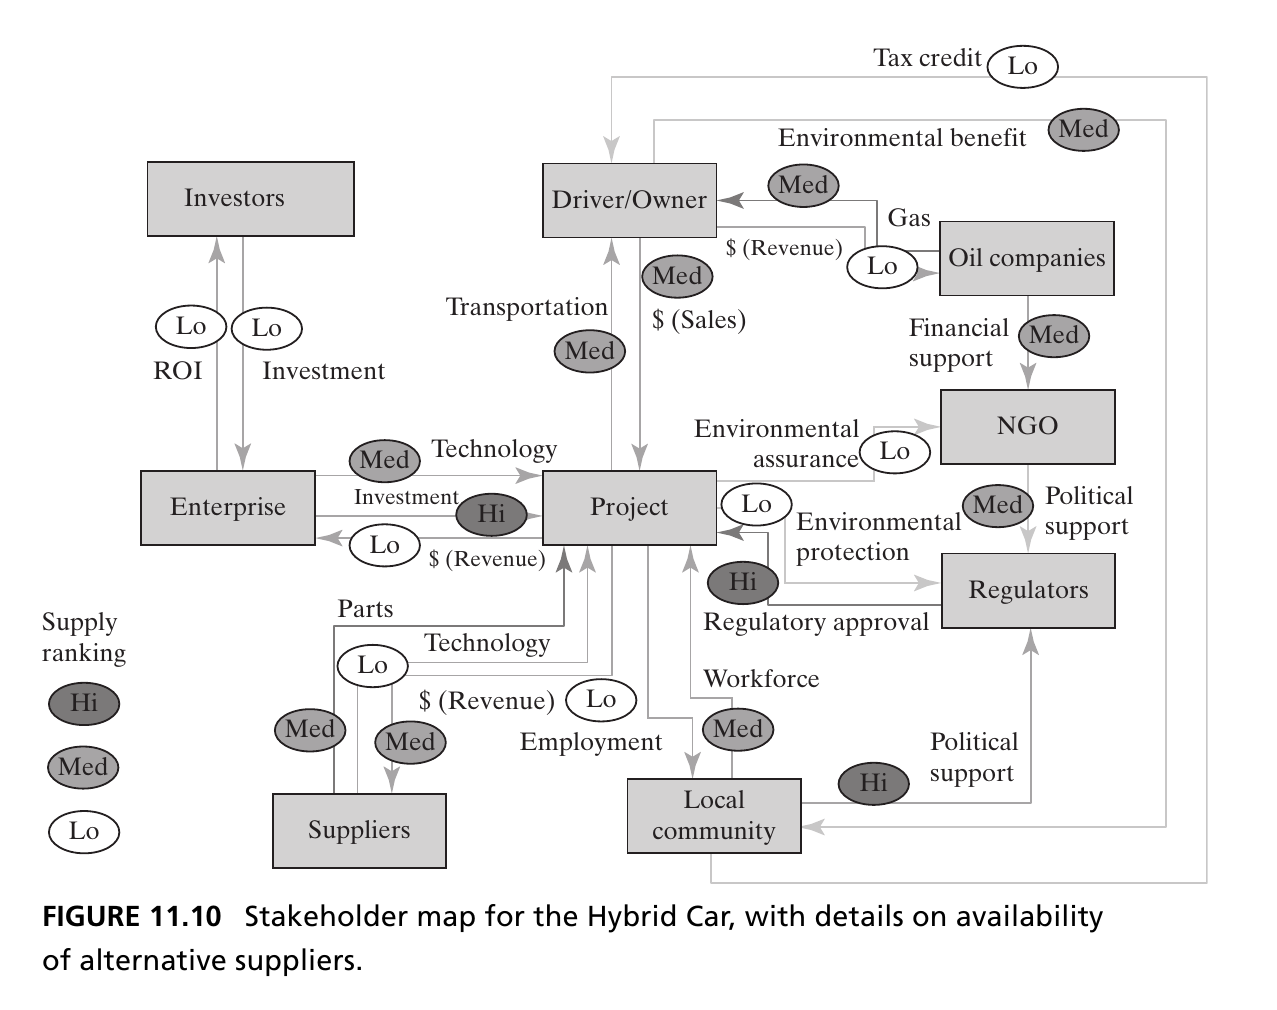
Supply availability is added to the stakeholder flows. The project is one of many possible sources of environmental protection, while the regulator is the only source of regulatory approval. Source: Crawley, Cameron & Selva (2016), Fig. 11.10.
Figure 11.11 · Combining Need and Flow Importance
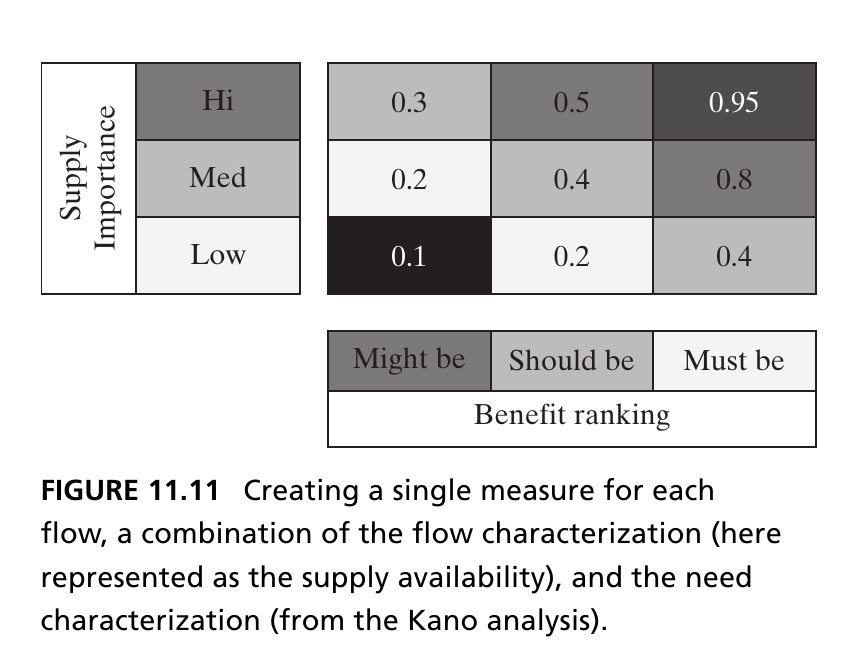
Illustrative meshing of Kano benefit rank with the importance of a supply flow. The resulting scores range from 0.1 to 0.95; they are an example scale, not universal conversion factors. Source: Crawley, Cameron & Selva (2016), Fig. 11.11.
Figure 11.12 · Direct Exchanges Can Mislead
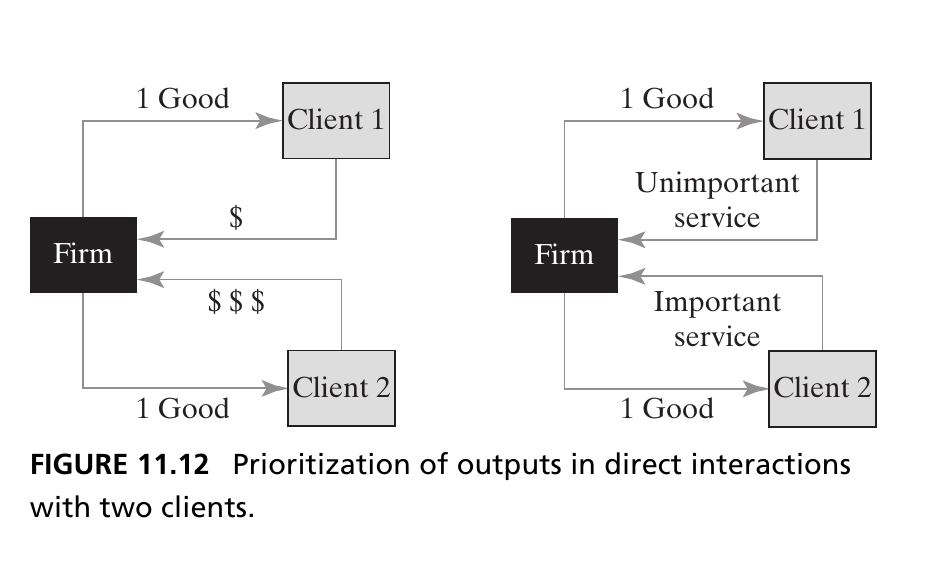
Revenue ranks two otherwise similar customers on the left. On the right, nonmonetary returns make the more important customer less obvious. Source: Crawley, Cameron & Selva (2016), Fig. 11.12.
Figure 11.13 · An Indirect Value Loop
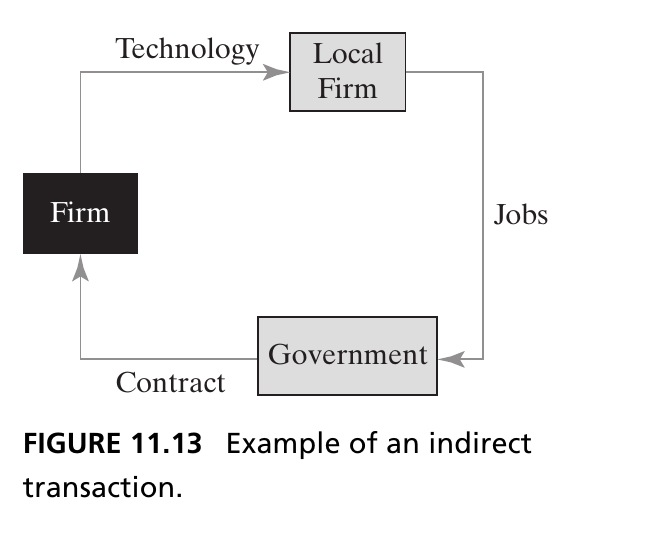
The firm supplies technology to a local partner; the partner creates jobs; the government awards a contract to the firm. The firm and government exchange value through an intermediary. Source: Crawley, Cameron & Selva (2016), Fig. 11.13.
Figure 11.14 · Prioritized Needs for the Hybrid Car
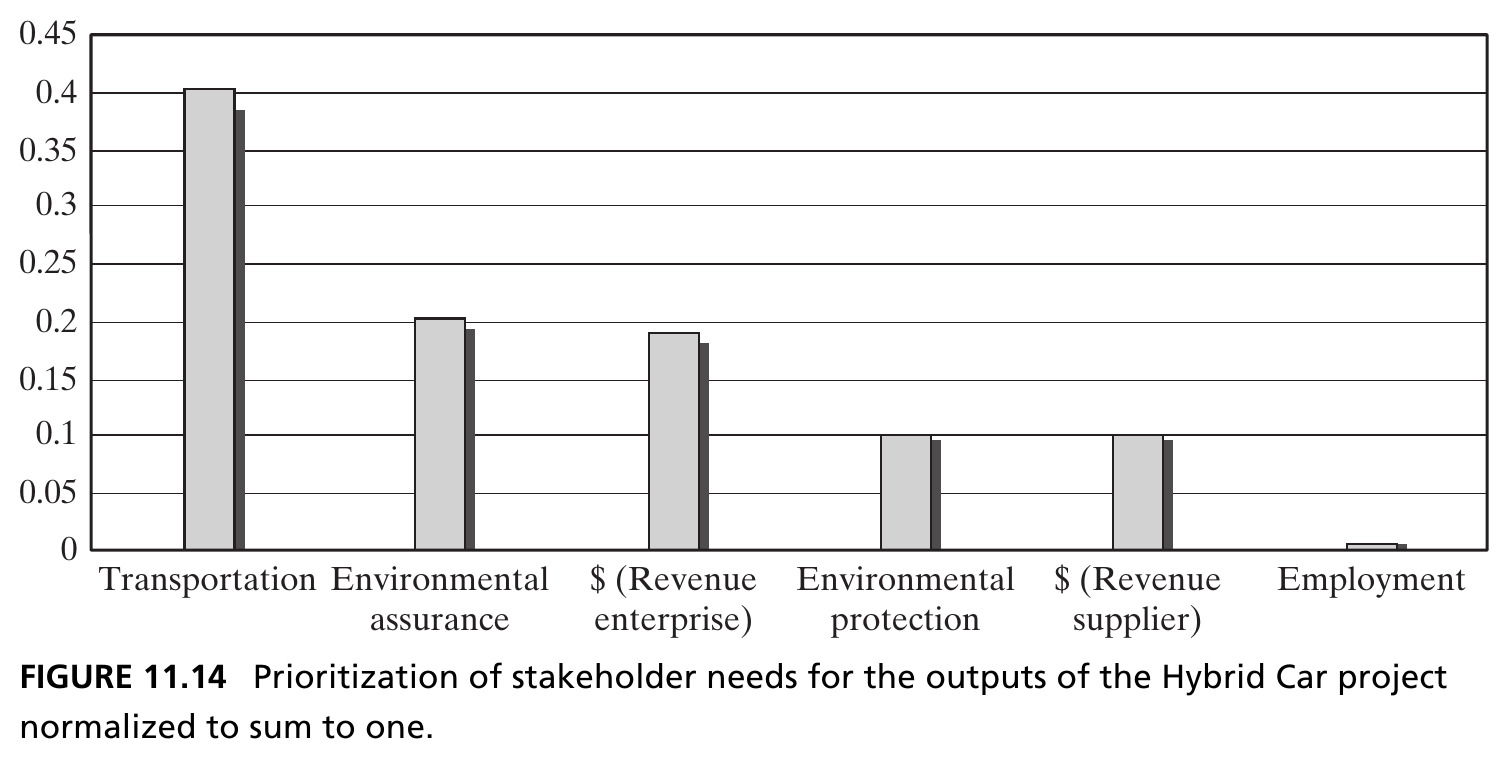
The preceding flow scores and value-loop comparisons yield a ranked, normalized priority for the outputs the project must deliver: transportation dominates, but environmental assurance and enterprise revenue matter too. Source: Crawley, Cameron & Selva (2016), Fig. 11.14.
Figure 11.15 · The To–By–Using Framework
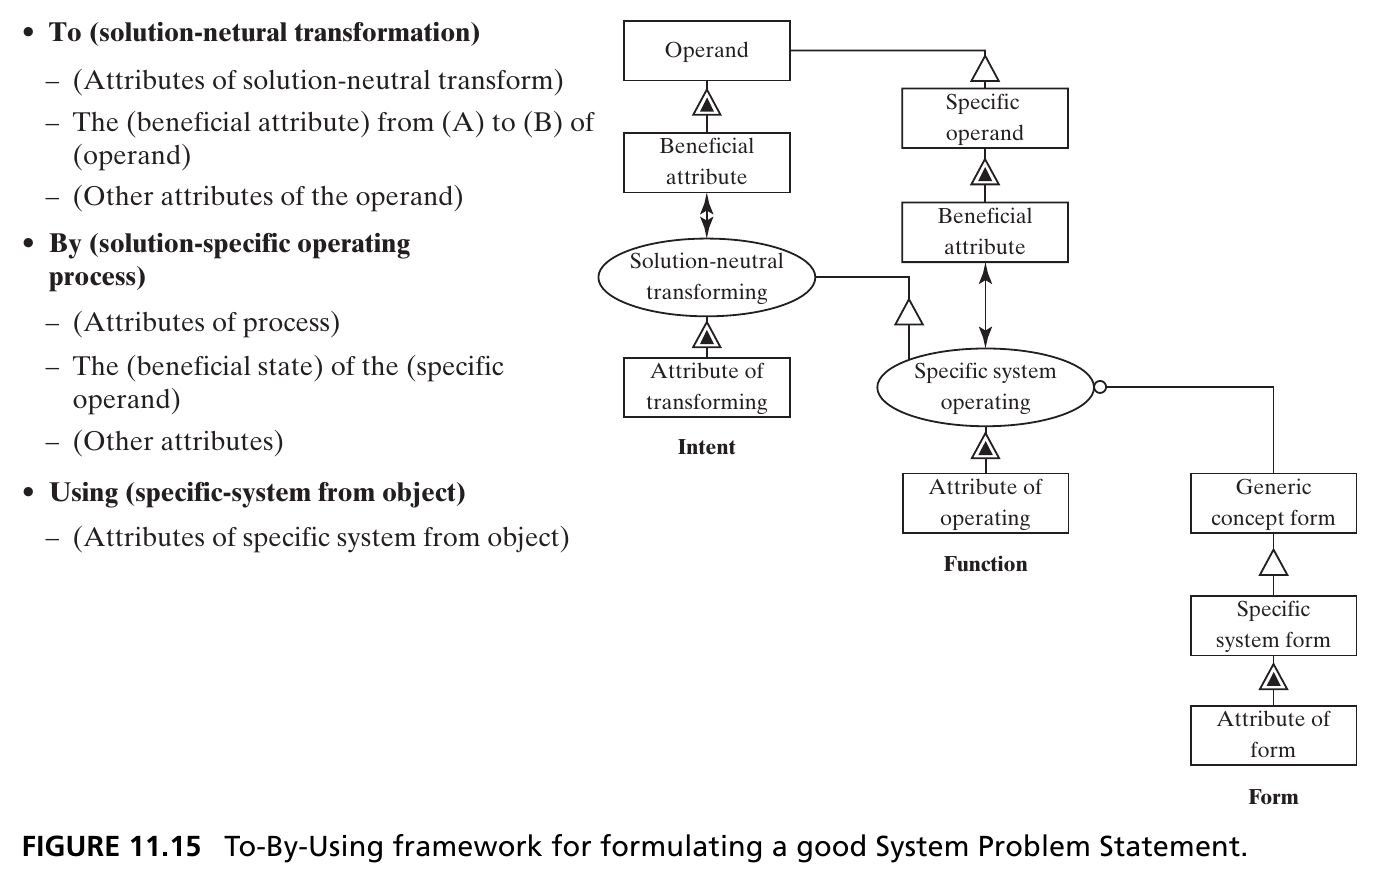
The general template separates solution-neutral intent (To), a specific operating process (By), and enabling form (Using), aligned with the OPM concept model. Source: Crawley, Cameron & Selva (2016), Fig. 11.15.
Figure 11.16 · System Problem Statement for the Hybrid Car
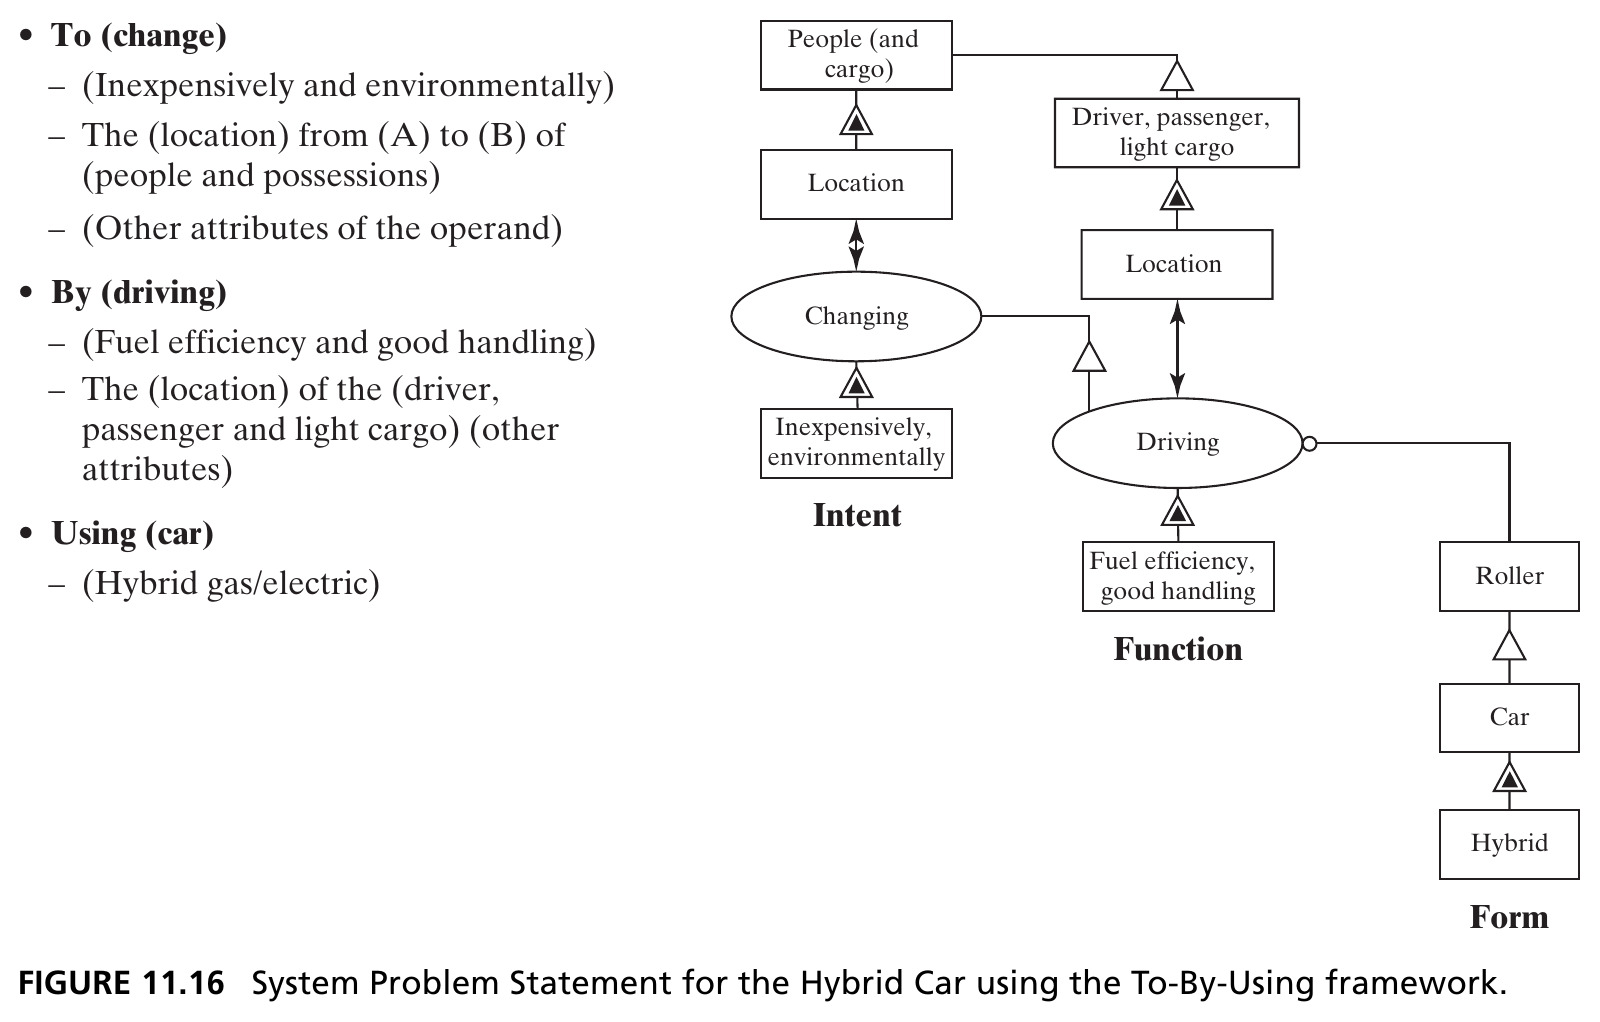
The To-By-Using framework maps directly onto the familiar OPM concept template (Fig. 7.4): intent → function → form. To change the location of people and cargo inexpensively and environmentally; by driving fuel-efficiently with good handling; using a hybrid car. Source: Crawley, Cameron & Selva (2016), Fig. 11.16.
Figure 11.17 · Checking Whether Goals Meet Criteria
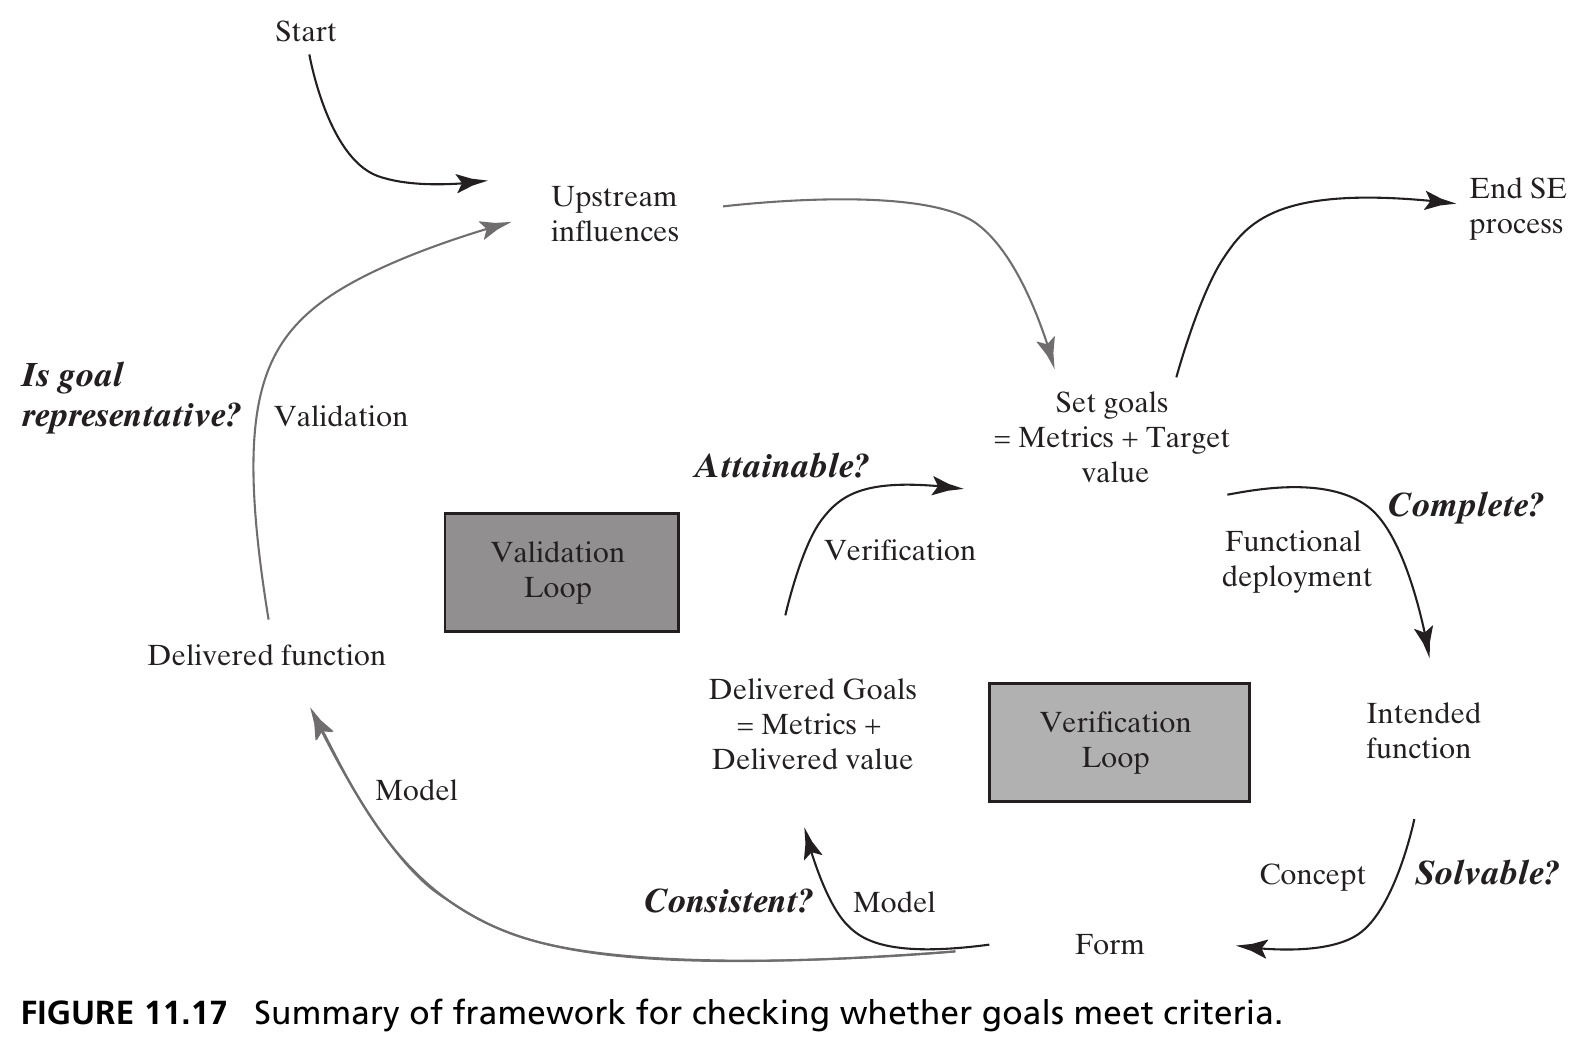
Two nested loops: the validation loop asks “is the goal representative?” by comparing delivered function against upstream influences; the verification loop asks “is it attainable, complete, consistent, solvable?” by comparing delivered goals against the concept, form, and intended function. Source: Crawley, Cameron & Selva (2016), Fig. 11.17.
Figure 11.18 · The Nagano IT System, Clients, and Users
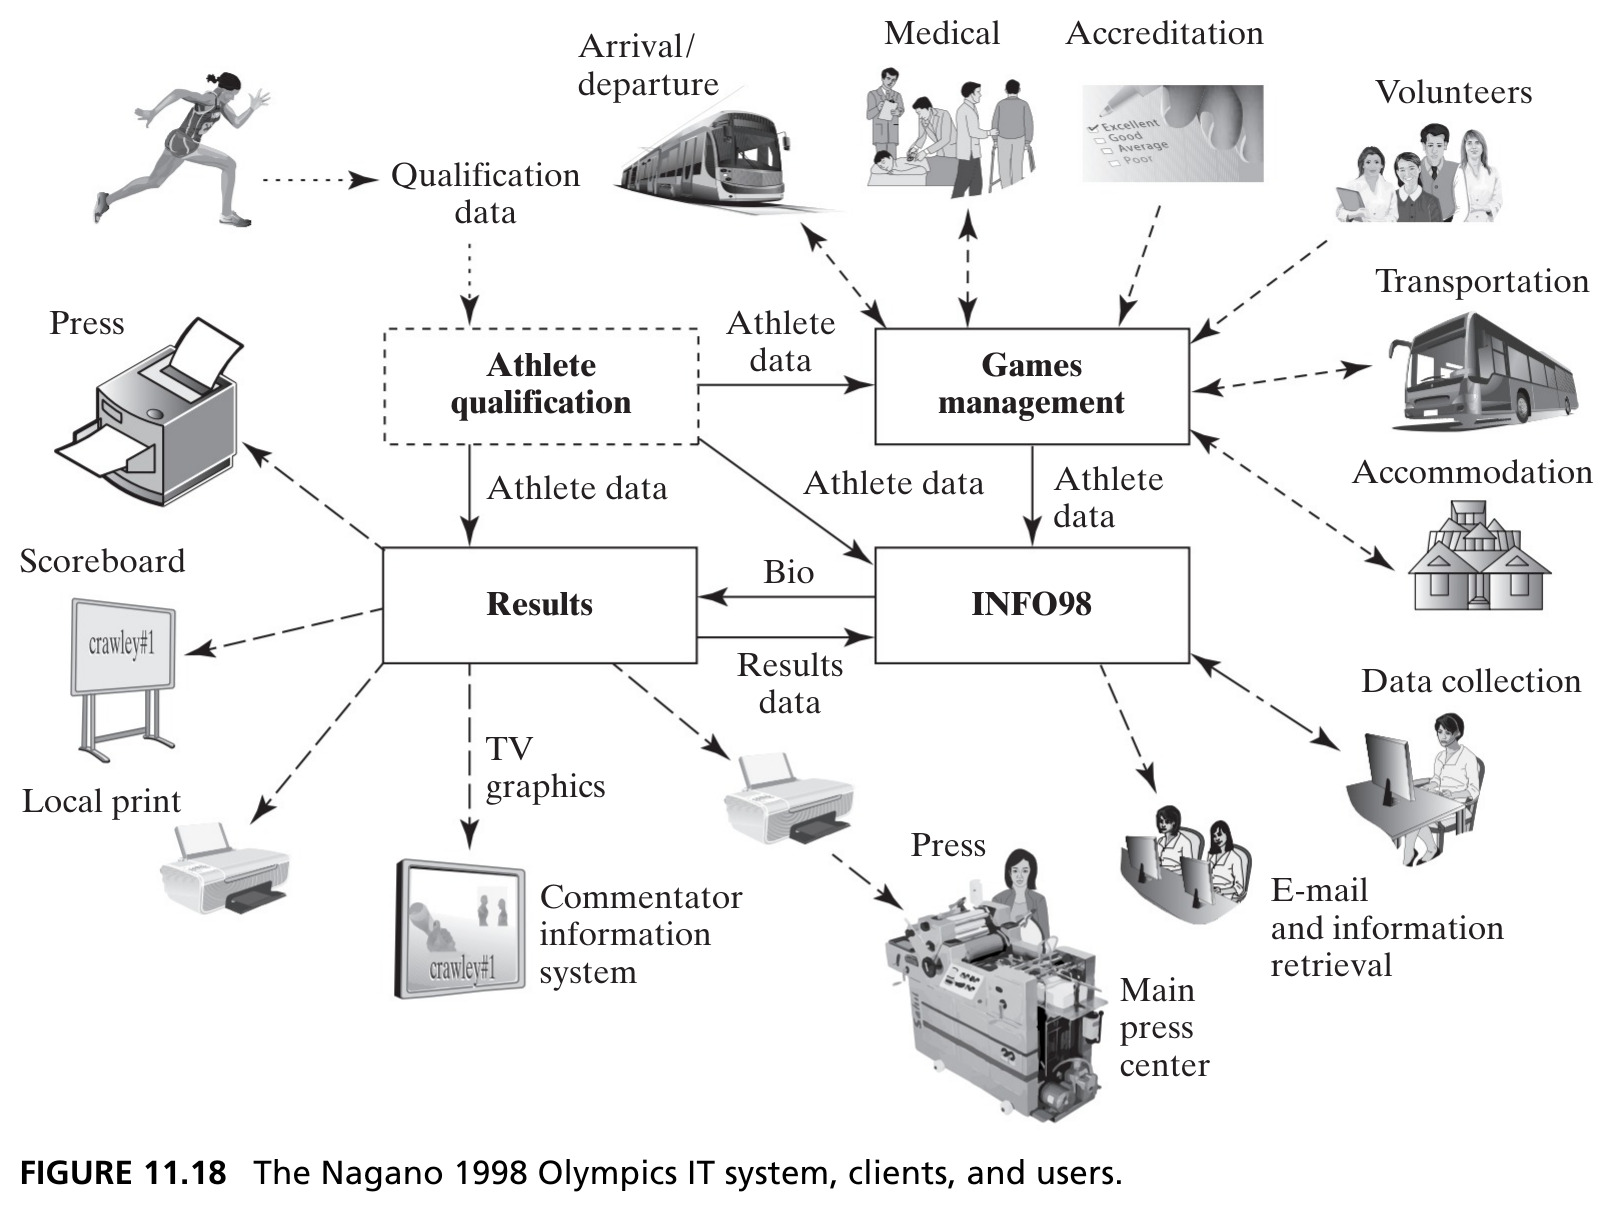
Athlete Qualification, Games Management, Results, and INFO98 form the core: surrounded by dozens of client stakeholders: press, medical, accreditation, transportation, accommodation, volunteers, and more. Source: Crawley, Cameron & Selva (2016), Fig. 11.18.
Figure 11.19 · Without X-Teams
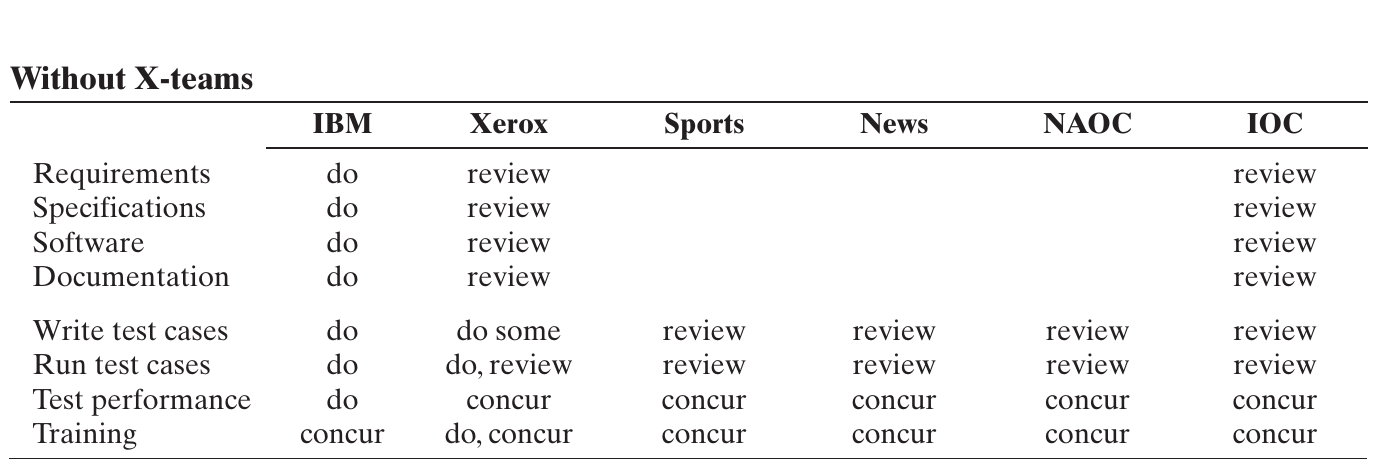
IBM writes requirements, specifications, software, and documentation. Xerox and the IOC review those artifacts; other stakeholders mainly review tests. Source: Crawley, Cameron & Selva (2016), Fig. 11.19 (upper table).
Figure 11.19 · With X-Teams
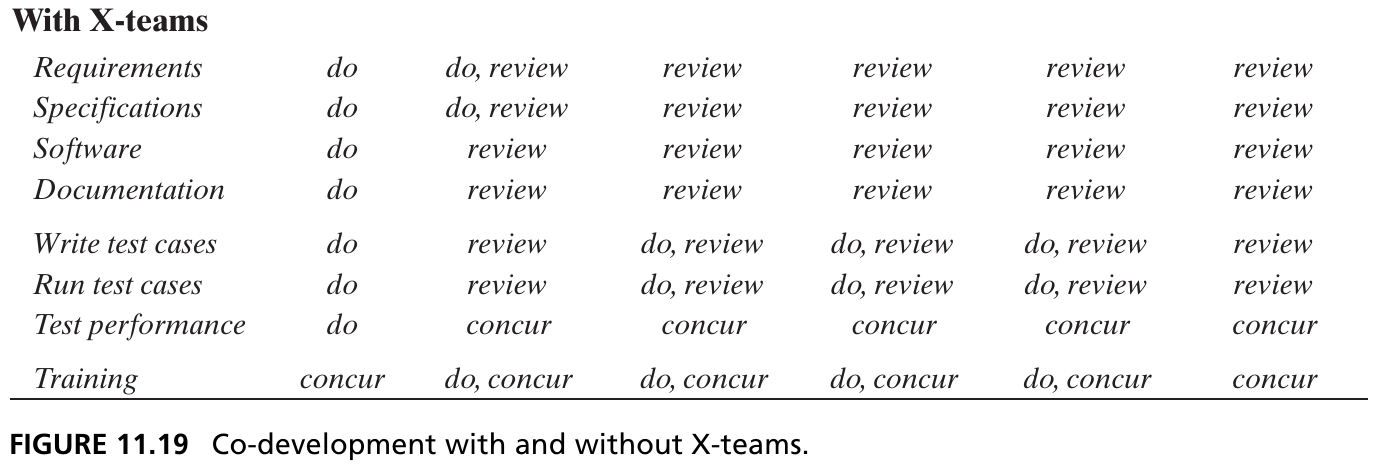
Columns remain IBM, Xerox, Sports, News, NAOC, IOC. Xerox joins requirements and specifications work; Sports, News, and NAOC take active roles in writing and running tests and in training. Source: Crawley, Cameron & Selva (2016), Fig. 11.19 (lower table).
Figure 11.20 · Nagano IT Data Flows
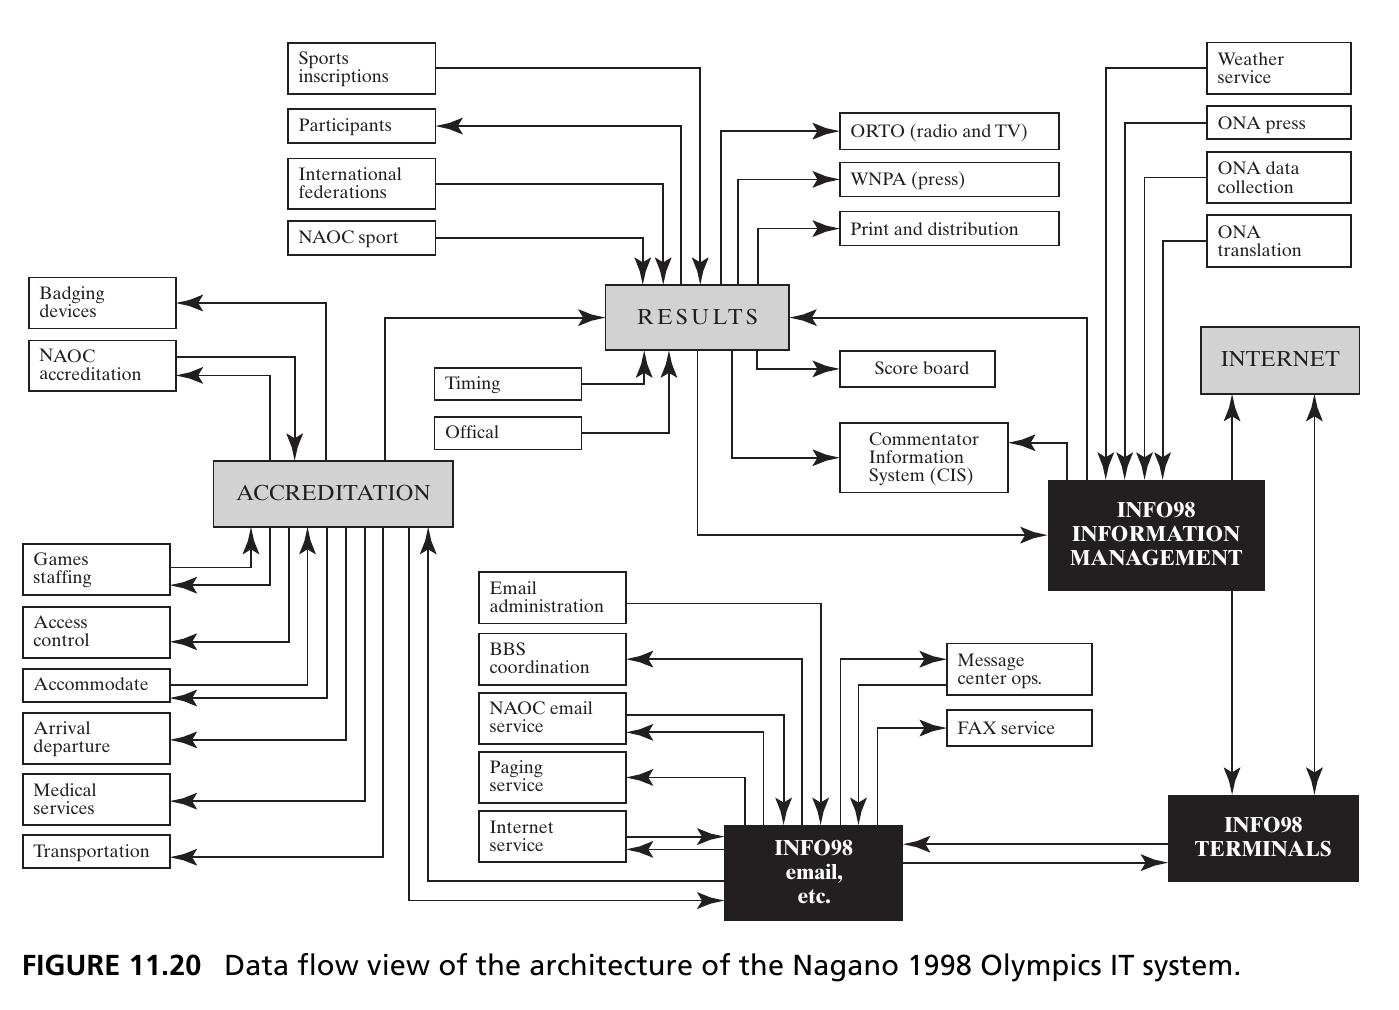
Results, accreditation, and INFO98 exchange data with organizers, media, scoreboards, and public information services. Source: Crawley, Cameron & Selva (2016), Fig. 11.20.
Figure 11.21 · Redundancy in the Results System
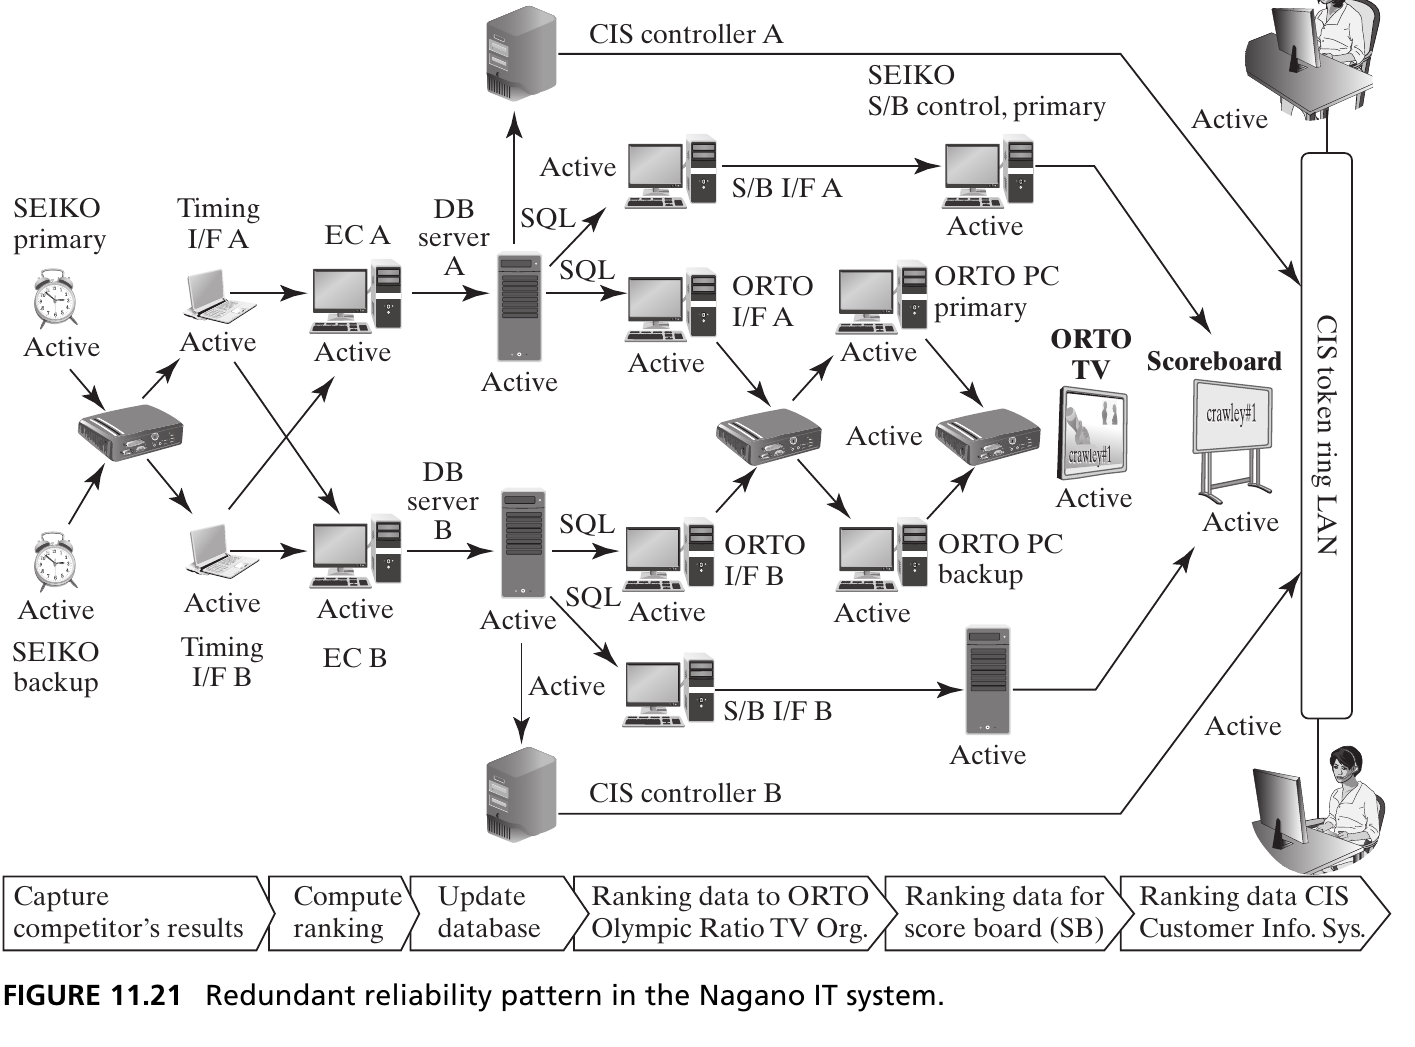
The Results System duplicates timing capture, event-control and database paths, and output interfaces to support continuous service. Source: Crawley, Cameron & Selva (2016), Fig. 11.21.