Thinking about Complex Systems
Systems Architecture · Chapter 3
Studying Complex Systems
- Chapter 2 used systems with two or three entities to introduce form, function, relationships, and emergence
- Engineering systems usually contain many interacting entities
- This chapter introduces methods for studying these systems:
- Decomposition and hierarchy
- Special logical relationships (class/instance, specialization, recursion)
- Techniques for reasoning through complex systems
- Architecture representation with OPM
Box 3.1 · Definition: Complex System
A complex system has many elements or entities that are highly interrelated, interconnected, or interwoven.
- The definition sets no fixed threshold for “many”
- Additional functions and demands for performance, robustness, or flexibility can increase complexity
- Connections to other systems also add complexity, such as a car communicating with traffic control or a house connected to the internet
Complex ≠ Complicated
Complex
An intrinsic property of the system: many interrelated, interconnected entities and relationships.
Complicated
A property of human perception: something overwhelms our ability to understand it. High apparent complexity.
A system should have the complexity it needs while remaining understandable to the people who work with it.
Architects use abstractions and representations to help people understand a complex system.
Introducing Team XT
- Team XT extends Team X from Chapter 2 with more people, while retaining its function of producing a design
- Task 1 identifies the system as the people and the process that develops the design
- Form = the people. Function = developing a design.
- Observation, experience, or interviews establish each member’s function. Table 3.1 lists 16 team members and four context participants, with their formal structure and functional interactions
Table 3.1 · The full Team XT
| Team XT | Form | Function | Function interaction | From/To | Location | Connectivity | Role |
|---|---|---|---|---|---|---|---|
| Sue | Evaluates and approves design | Gets finalized concept/requirements | John, Amy | Cambridge | Share design tool | Team XT manager | |
| Amy | Finalizes requirements | Gets draft requirements document | Jose, Vladimir | Cambridge | Share requirement tool | Requirements group leader | |
| Jose | Develops requirement documents | Gets strategy and regulatory input | Mats, Ivan | Cambridge | Share requirement tool | Group member | |
| Vladimir | Develops requirement documents | Gets needs and competitive analysis | Heather | Cambridge | Share requirement tool | Group member | |
| Ivan | Interprets regulations | N/A | Cambridge | Share requirement tool | Group member | ||
| Mats | Interprets corporate strategy | N/A | Cambridge | Share requirement tool | Group member | ||
| John | Develops finalized concepts | Gets evaluated options | Mark | Moscow | Share design tool | Concept group leader | |
| Natasha | Develops conceptual options | Gets finalized requirements | Amy | Moscow | Share requirement tool | Group member | |
| Analyst 1 | Analyzes designs | Gets conceptual options | Natasha | Moscow | Share design tool | Group member | |
| Analyst 2 | Analyzes designs | Gets conceptual options | Natasha | Moscow | Share design tool | Group member | |
| Mark | Evaluates design options | Gets analysis | Analyst 1,2 | Moscow | Share design tool | Group member | |
| Phil | Leads supporters | N/A | Cambridge | Support group leader | |||
| Nicole | Provides IT support | Supports design tool | Design tool users | Cambridge | Group member | ||
| Meagan | Coaches team | Supports group leaders | John, Amy | Cambridge | Group member | ||
| Alex | Models project finances | Supports design analysts | Analyst 2 | Cambridge | Share design tool | Group member | |
| Dimitri | Provides administrative support | Supports manager | Sue | Cambridge | Group member | ||
| System boundary | |||||||
| Marketing | Cambridge | ||||||
| Heather | Determines needs | Gets competitive analysis | Chris | Cambridge | |||
| Chris | Does competitive analysis | N/A | Cambridge | ||||
| Operations | Cambridge | ||||||
| Karen | Plans manufacturing | Gets final design | Sue | Cambridge | |||
| James | Plans supply chain | Gets final design | Sue | Cambridge | |||
Source: Crawley, Cameron & Selva, System Architecture (2016), Table 3.1, p. 51. Retypeset. Blank cells and N/A retained. Zoom: Ctrl-click on Linux. Alt/Option-click on Windows/Mac. Repeat to return.
Figure 3.1 · Function and Interaction in Team XT
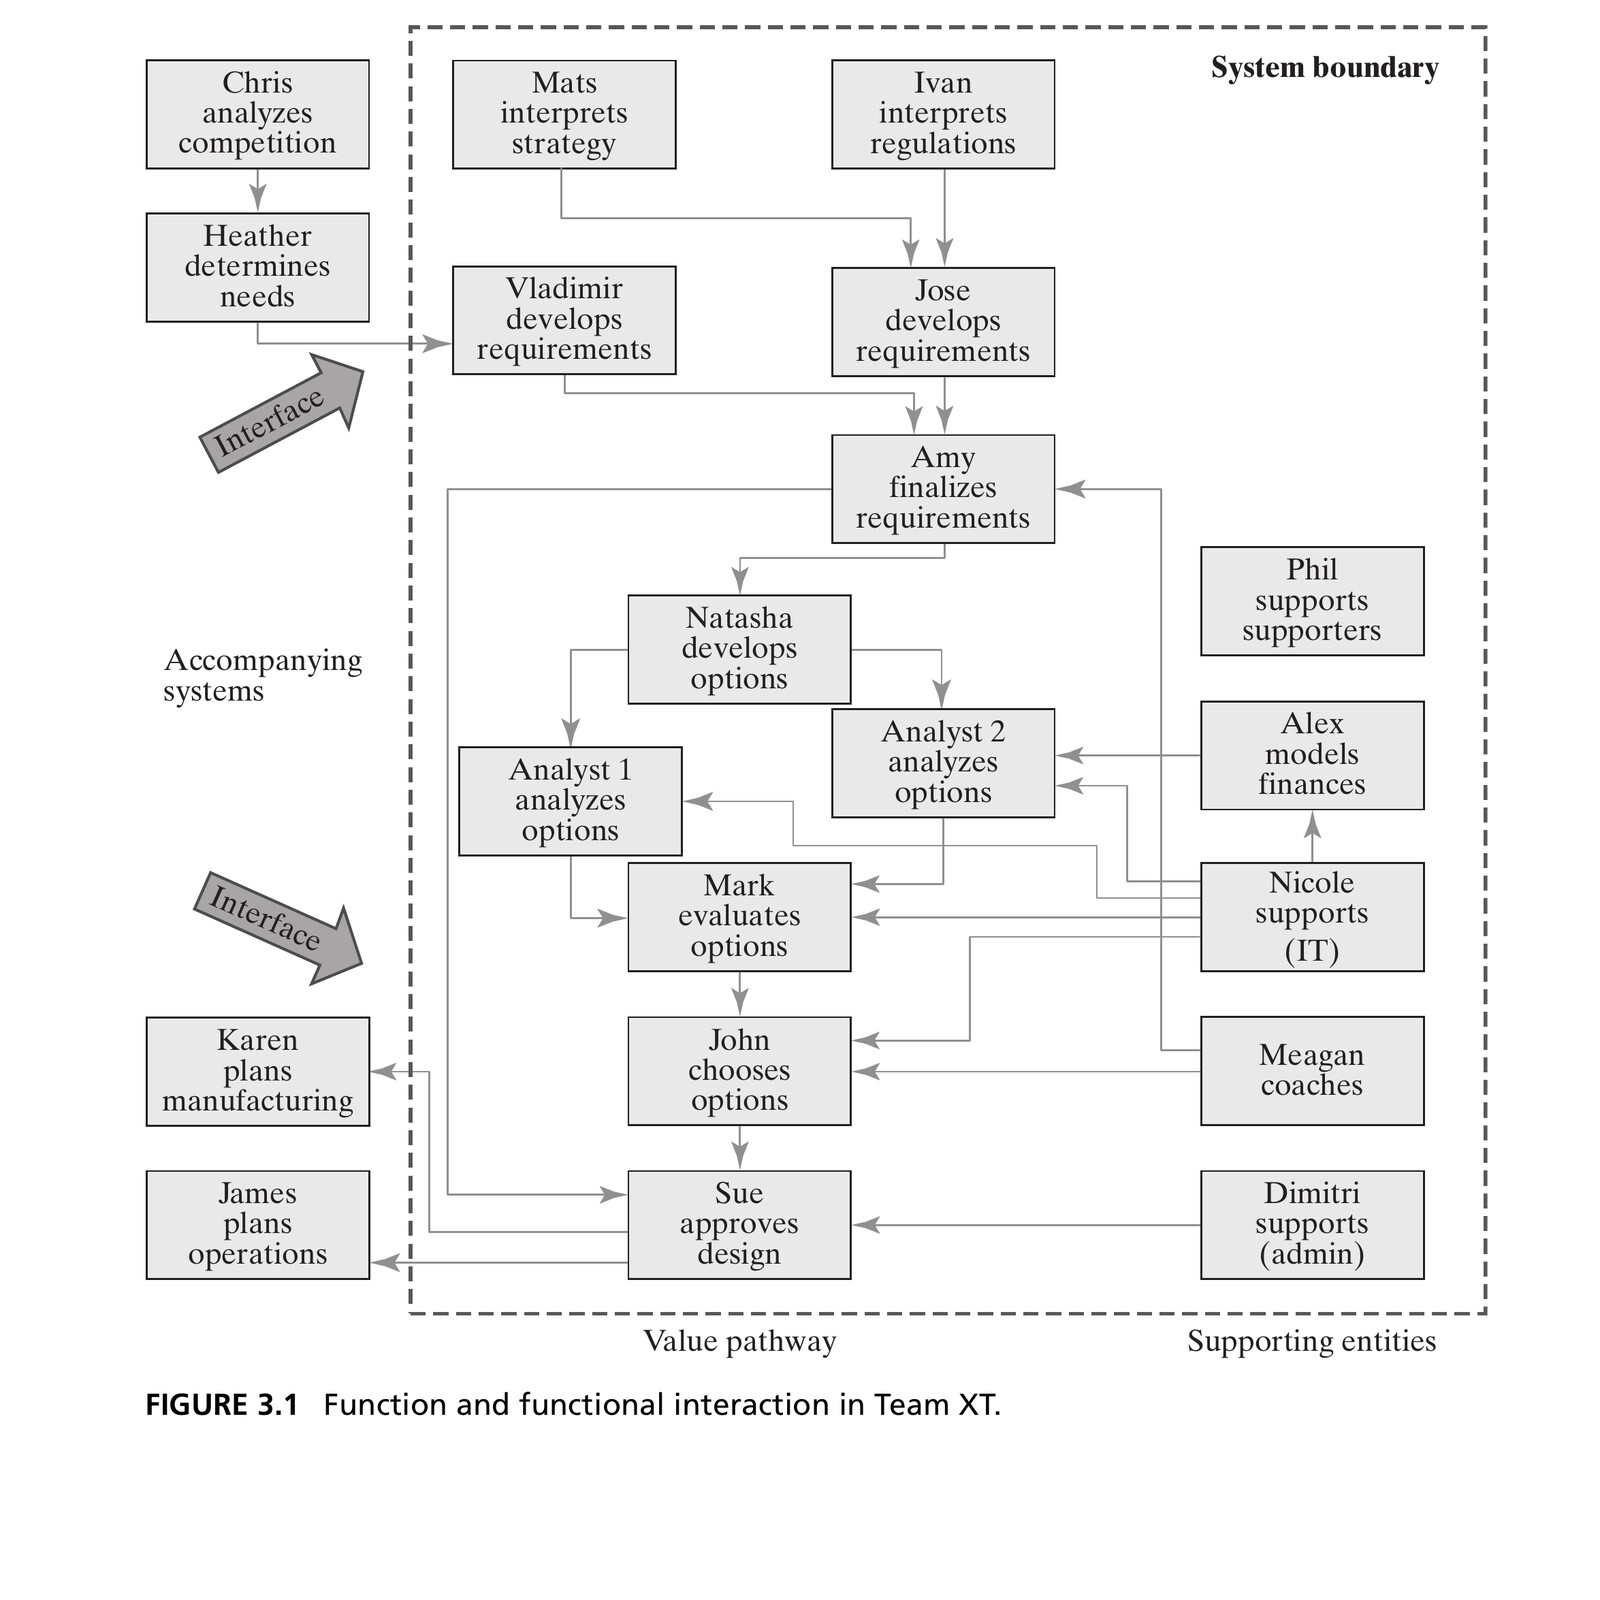
The value pathway runs down the center. IT, coaching, administration, and finance provide support through links from the right. Marketing and Operations sit outside the system boundary. Source: Crawley, Cameron & Selva (2016), Fig. 3.1.
Decomposition and Integration
- Decomposition divides an entity into smaller constituents
- Smaller parts let us examine or solve portions of a larger problem
- Integration brings those parts together and checks that they work as a whole
“All Gaul is divided into three parts.”
Julius Caesar, The Gallic Wars
In the formal domain, aggregation concerns how physical or logical parts fit together. In the functional domain, we examine how simpler functions interact and what behavior emerges when we combine them.
Hierarchy
- Hierarchy arranges entities in ranked layers or grades, as in many social systems
- What makes one grade rank above another?
- More scope: a governor outranks a mayor (a state is larger than a city)
- More importance or performance: a black belt outranks a brown belt
- More responsibility: a president outranks a vice president
Figure 3.2 shows the hierarchy that Figure 3.1 leaves unspecified: Sue ranks above the group leaders Amy, John, and Phil, who rank above the other members.
Figure 3.2 · Hierarchy in Team XT
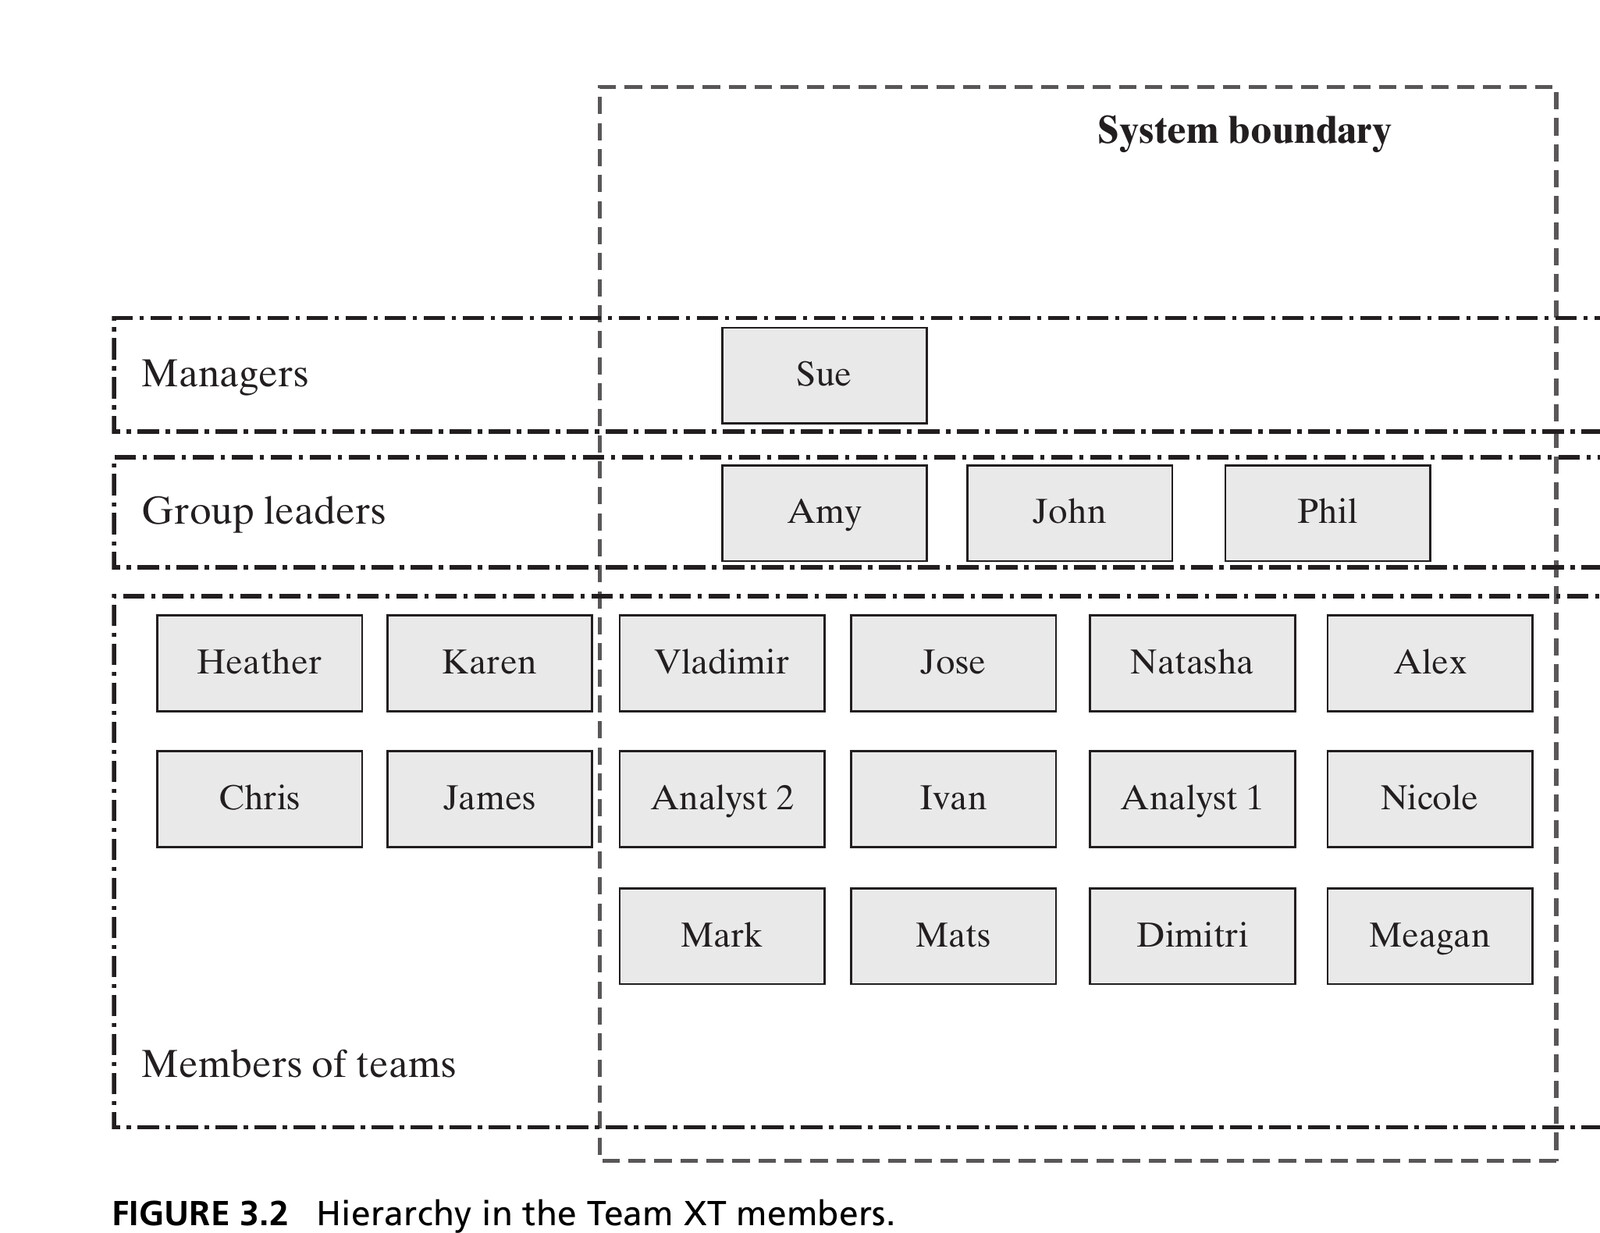
Three ranked layers show managers, group leaders, and members. The diagram leaves reporting relationships within each layer unspecified. Source: Crawley, Cameron & Selva (2016), Fig. 3.2.
Hierarchic Decomposition
- Often, decomposition and hierarchy combine into a hierarchic decomposition: more than two levels, with reporting relationships between them
- Smaller groups are easier to scan than a flat list. The text uses seven ± two as a rough grouping guide
- Requirements, Concepts, and Support provide one grouping. Other questions may call for grouping by location, connectivity, or functional relationship
Figure 3.3 · Hierarchic Decomposition of Team XT
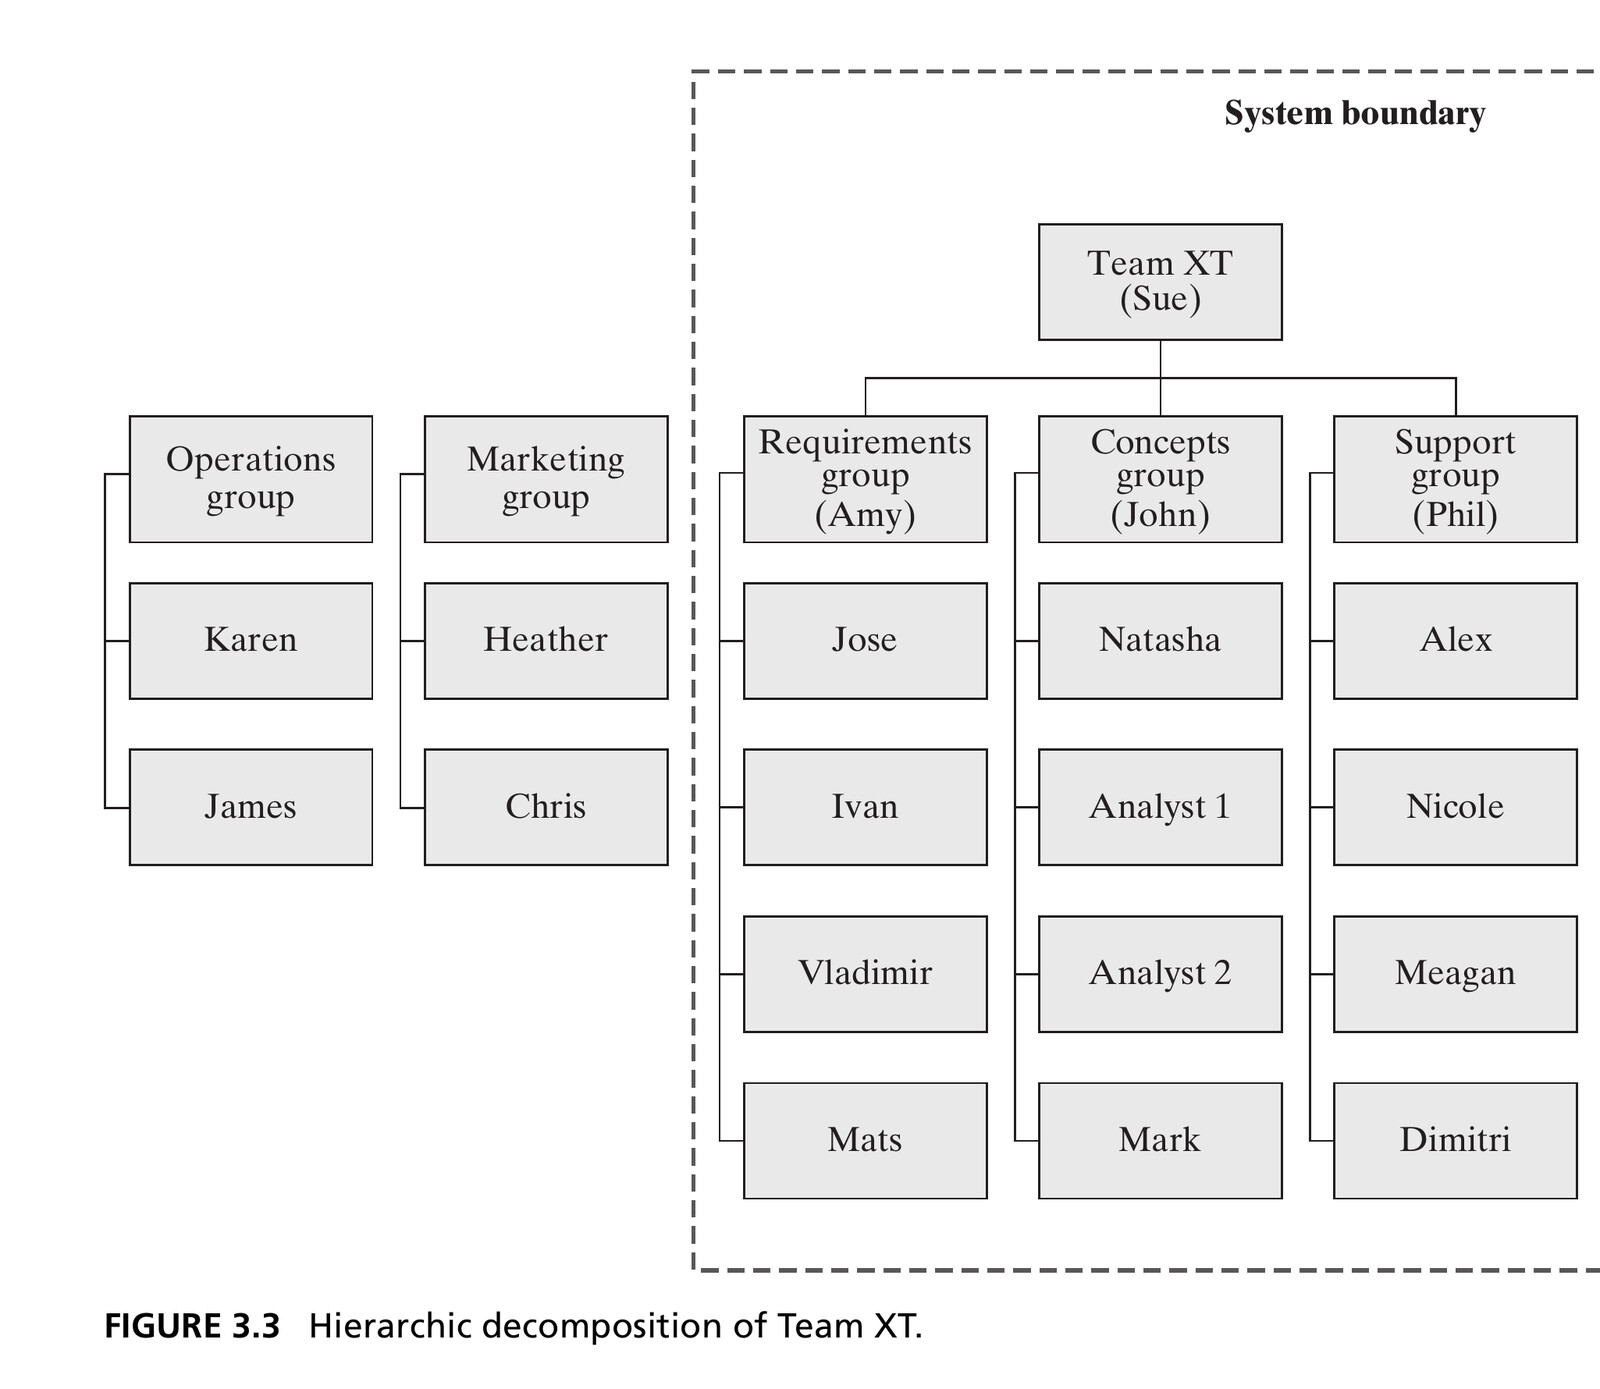
Three group leaders reporting to Sue, about four people reporting to each leader. Source: Crawley, Cameron & Selva (2016), Fig. 3.3.
Simple, Medium, and Complex Systems
- Simple system: a one-level decomposition into essentially atomic elements, using 7 ± 2 as a rough guide (Figure 3.4)
- Medium-complexity system: a two-level decomposition, with up to 9² = 81 elements at the lowest level under that guide (Figure 3.3)
- Complex system: a two-level diagram whose lowest elements are still abstractions of further structure
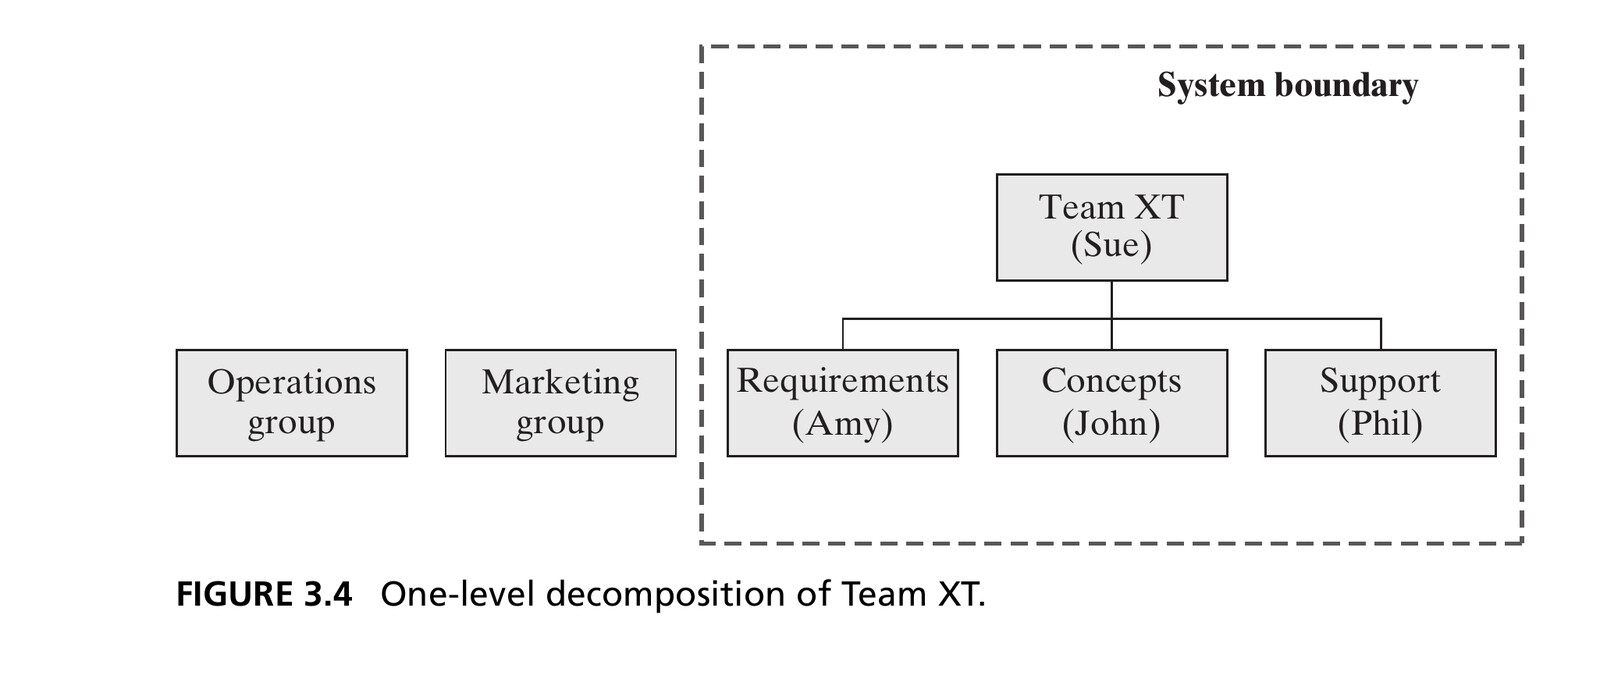
Figure 3.4: one-level decomposition of Team XT. Source: Crawley, Cameron & Selva (2016).
Practical scale limit
Decomposition diagrams usually show one or two levels at a time. With nine elements per grouping, a third level could contain 729 elements.
Decomposition Levels and Atomic Parts
- Level 0 is the reference system. Level 1 down and Level 2 down describe its constituents at successive depths. The architect’s viewpoint determines Level 0
- Names such as module, assembly, component, routine, and section vary across disciplines and organizations
Atomic part: from Greek átomos, “indivisible.”
- Mechanical systems: “Call it a part when you can’t take it apart.”
- Informational systems: “Call it a part if it loses meaning when you take it apart.”
3.4 Special Logical Relationships
The Class/Instance Relationship
- A class describes a category’s general features. An instance is a particular occurrence of that class
- A car model defines a class. A Vehicle Identification Number (VIN) identifies an individual car, which is an instance
- A part number refers to a class. A serial number identifies an instance
Class and instances in Team XT
Table 3.1’s Analyst 1 and Analyst 2 can be represented as instances of the class Analyst. The 11 players on a soccer team and the 88 keys of a piano are instances of the classes “Player” and “Key.”
The Specialization Relationship
- Specialization/generalization describes the connection between a general object and a set of more specific objects
- Colonial, Victorian, and modern houses are more specific kinds of “House”
- In Team XT, we created three specializations of the generalization “Group”: a requirements group, a design (concepts) group, and a support group
Specialization is akin to inheritance in object-oriented programming: a class is created from a more general class, inheriting some attributes and functionality while adding its own.
Recursion
- Recursion: an object or process defined in terms of itself, or an organizing pattern that repeats at successive levels
- Team XT contains three groups that are themselves small teams, repeating the team structure one level down
- Software engineering uses recursion explicitly and often: a class
Nodewith an attributeNeighborsthat is itself an array ofNodes
3.5 Reasoning through Complex Systems
Top-Down / Bottom-Up / Middle-Out
Top-down
Start from the goals of a system, proceed to concept and high-level architecture, then increase detail until reaching the smallest entities of interest. Follows the “left-hand side” of the systems-engineering V model.
Bottom-up
Start from the artifacts, capabilities, or services available at the lowest-level entities, and build upward, predicting emergence.
Middle-out
Start at an intermediate level and reason about the levels above and below it. The chosen system is usually part of a larger system.
Zigzagging
- Term coined by Nam Suh in his work on axiomatic design
- Alternate between form and function, using each decision to guide the next
- For Team XT, begin with developing a design, propose small groups, then identify what each group must do. Repeat at lower levels
Architectural reasoning in practice
Zigzagging between form and function can accompany top-down, bottom-up, or middle-out reasoning.
3.6 Architecture Representation: OPM
Views and Projections
A description of a complex system’s architecture contains more information than any one person can readily comprehend.
Integrated model and projections: generate the needed views from one shared model. In 3D CAD, for example, floor plans, façades, and sections derive from the same geometry.
This course uses OPM (Object-Process Methodology), which follows the integrated-model approach.
OPM
- Dov Dori developed Object-Process Methodology at Technion to represent objects and processes in one model
- Objects (boxes) and processes (ovals) connect through typed relationships. An object can enable a process as an instrument, or a process can change it
- A single model holds form, function, and logical relationships. Individual diagrams display selected details
Figure 3.6 · An OPM Diagram
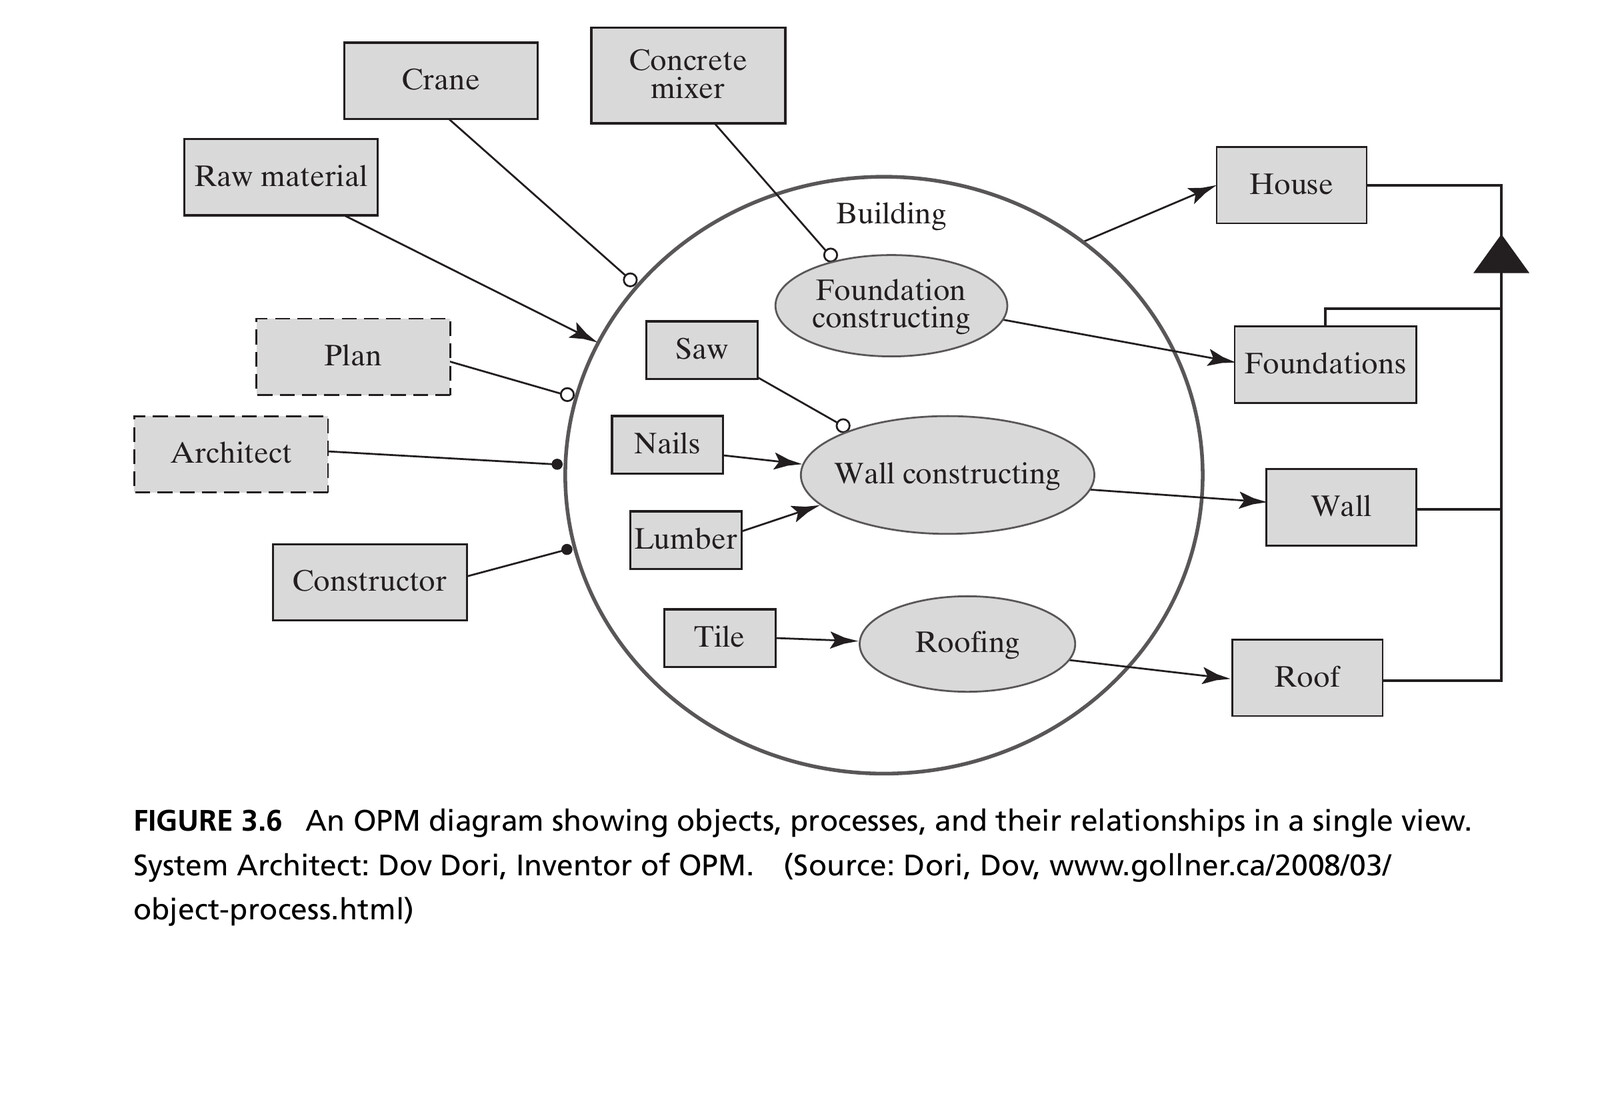
Building a house: objects (Crane, Lumber, Foundations…) and processes (Foundation constructing, Wall constructing, Roofing) in one view. System Architect: Dov Dori, inventor of OPM. Source: Dori, D., gollner.ca (2008), reproduced in Crawley, Cameron & Selva (2016), Fig. 3.6.
OPM Representations
OPM has its own visual conventions for the logical relationships from Section 3.4:
| Relationship | OPM Notation |
|---|---|
| Decomposition / aggregation | Triangle-headed tree |
| Specialization / generalization | Open-triangle tree |
| Class / instance | Paired filled/open-triangle tree |
Course modeling convention
This course uses OPM as its architecture representation tool throughout.
Section 3.7 Summary
| Feature of Complex Systems | Approach |
|---|---|
| Smaller entities make up the system | Use decomposition and hierarchy, showing about two levels at a time or stopping at atomic parts |
| Logical relationships recur among entities | Identify class/instance, specialization/generalization, and recursion |
| Relationships connect levels, form, and function | Reason top-down, bottom-up, or middle-out, and zigzag between form and function |
| Architecture can be viewed or projected for understanding | Project from a single integrated model (OPM) |
Next: Form
Chapter 4 begins Part 2, Analysis of System Architecture, which examines form and function in more detail.
Reference
Crawley, E., Cameron, B., & Selva, D. (2016). System Architecture: Strategy and Product Development for Complex Systems. Pearson. Chapter 3.

← Course Home · Systems Architecture · Chapter 3